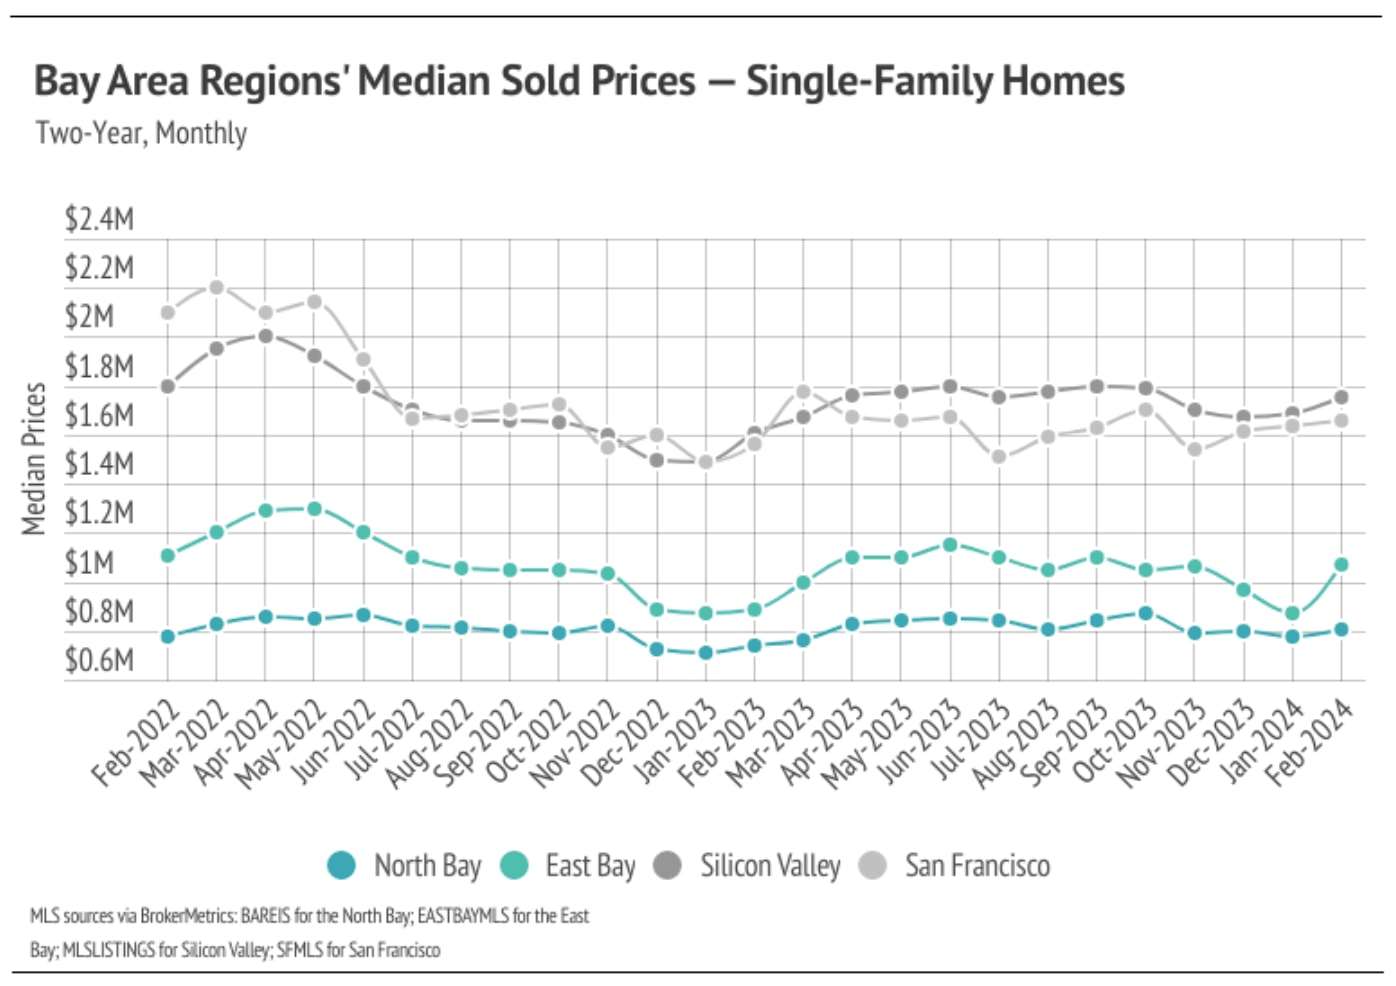
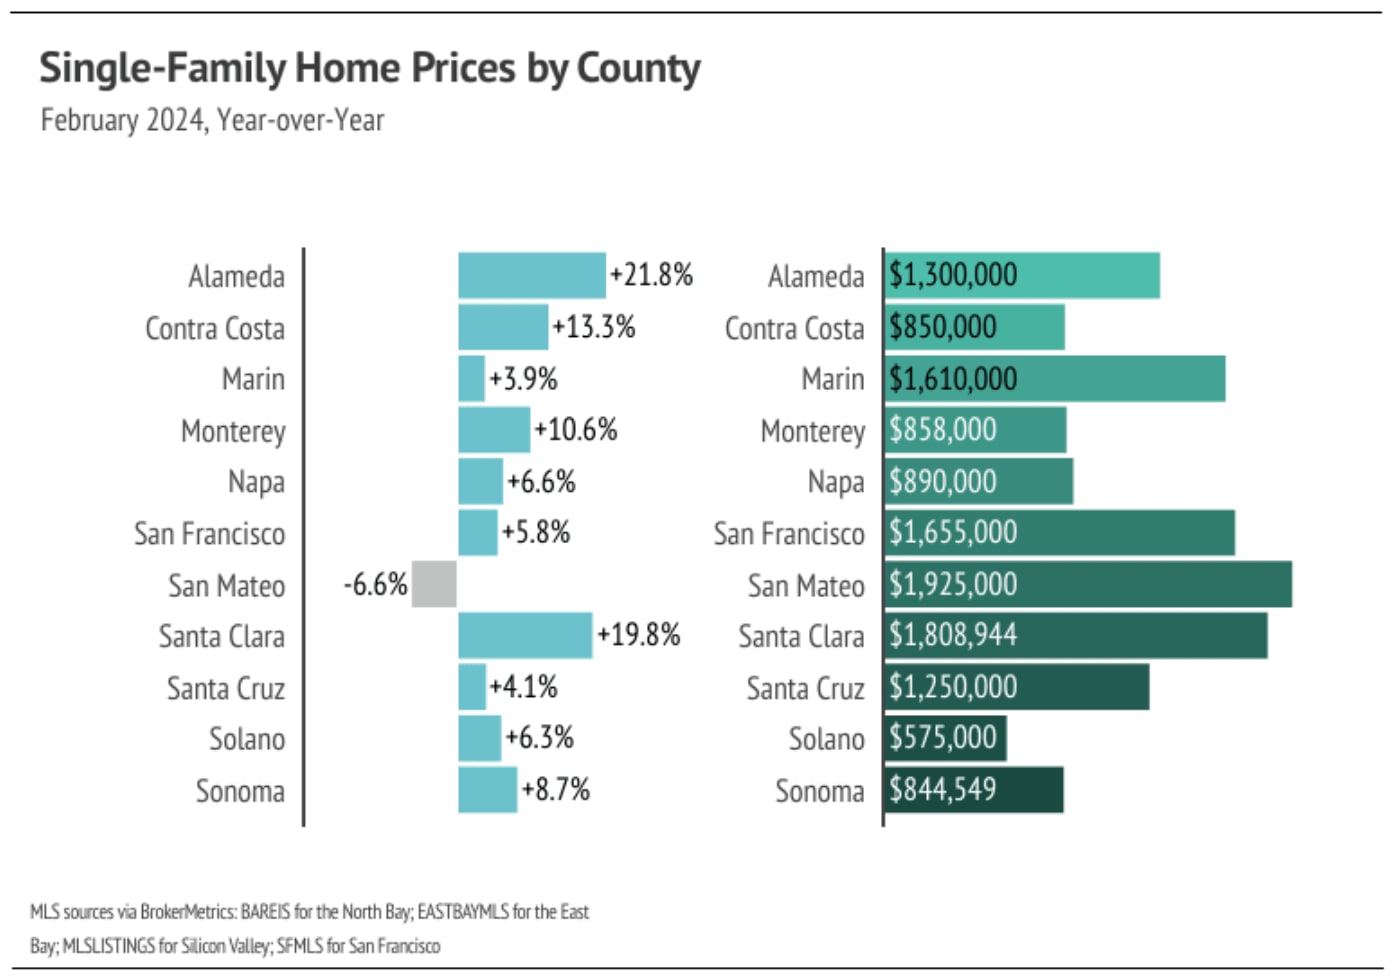
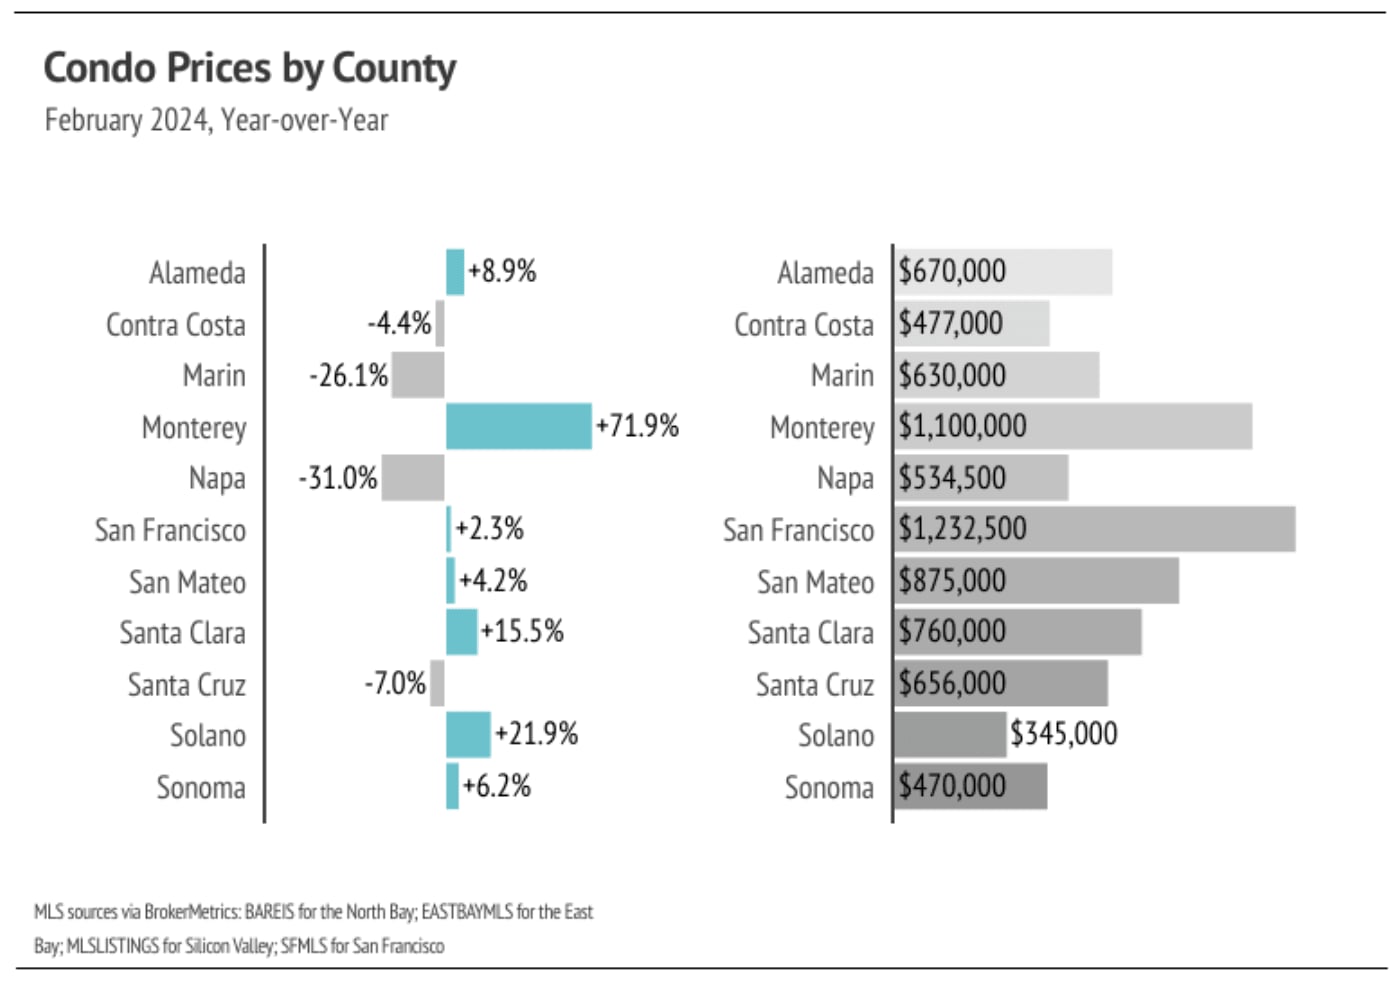
In the Greater Bay Area, low inventory and high demand have more than offset the downward price pressure from higher mortgage rates, and prices generally haven’t experienced larger drops due to higher mortgage rates since the initial period of price correction from April 2022 to January 2023. In February, the median prices across most Bay Area counties were only slightly below their record highs with the exception of Marin and San Francisco, which peaked incredibly high in 2022. We expect prices to remain fairly stable in the winter months, but as interest rates decline and more sellers come to the market, prices will almost certainly rise in the first half of 2024. However, more homes must come to the market in the spring and summer to get anything close to a healthy market. Additionally, inventory is so low that rising supply will only increase prices as buyers are better able to find the best match.
High mortgage rates soften both supply and demand, but at this point rates have been above 6% for 15 months, and rate cuts will likely occur sometime this year. Potential buyers have had longer to save for a down payment and will have the opportunity to refinance in the next 12-24 months, which makes current rates less of a limiting factor. However, high demand can only do so much for the market if there isn’t supply to meet it.
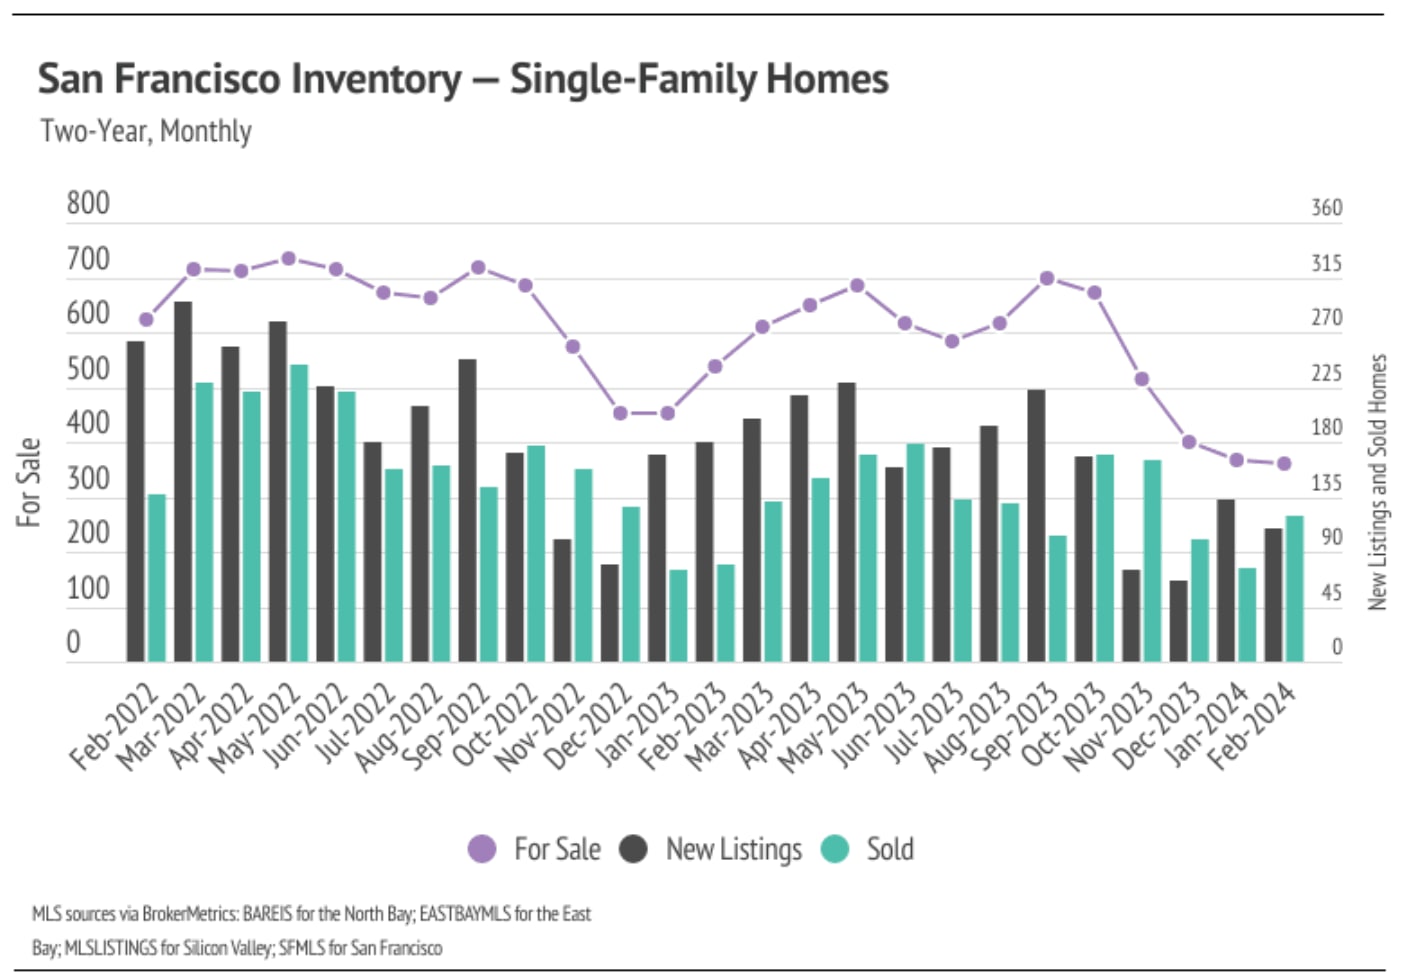
Single-family home and condo inventory, sales, and new listings increased month over month
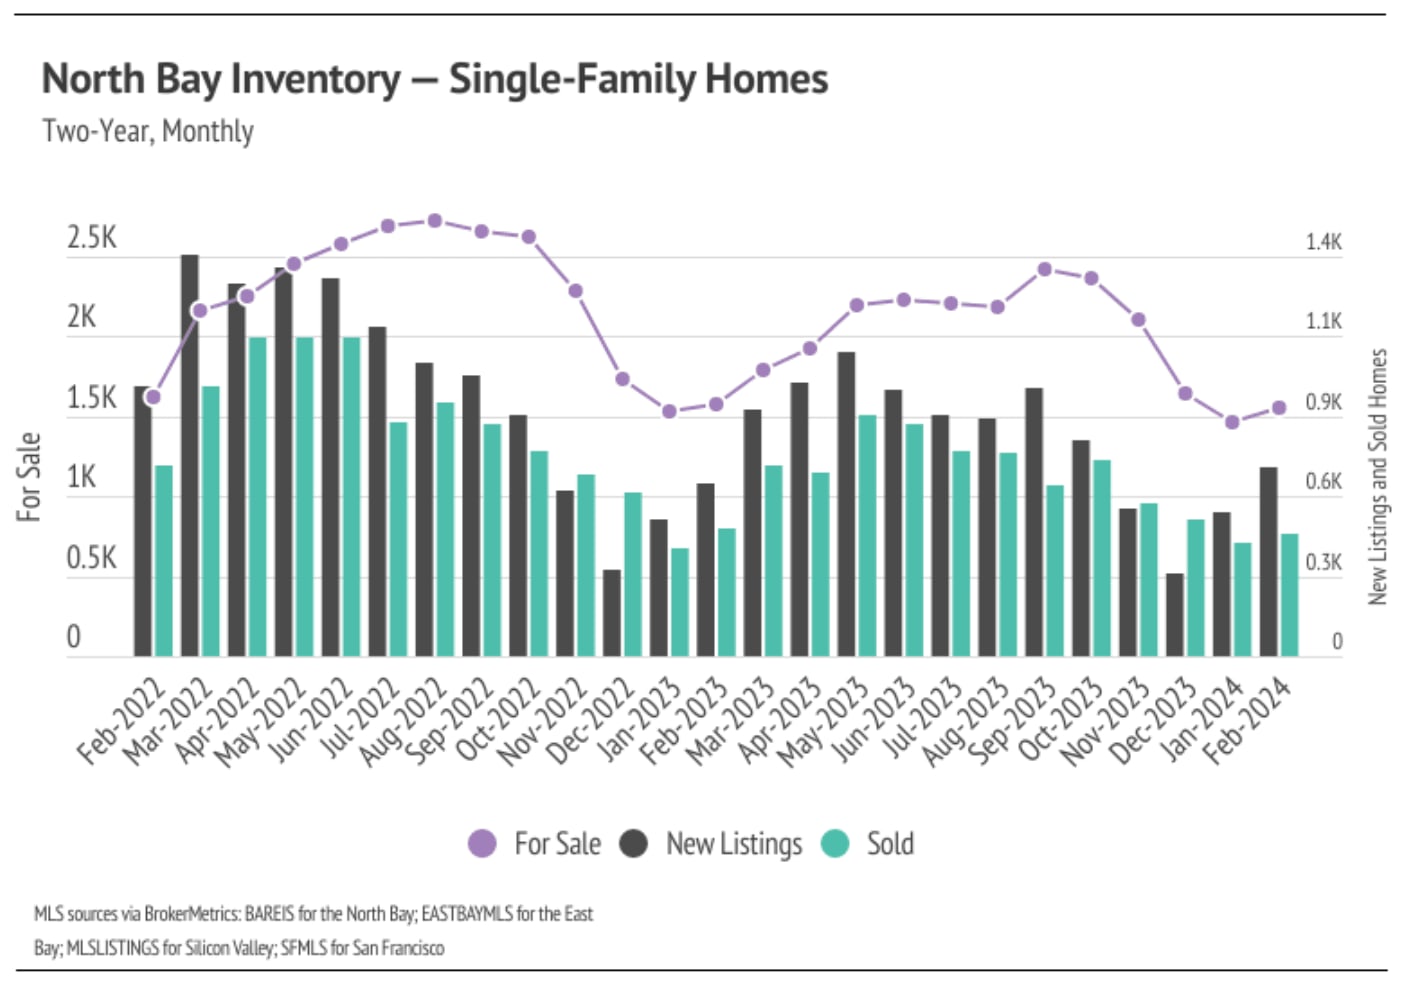
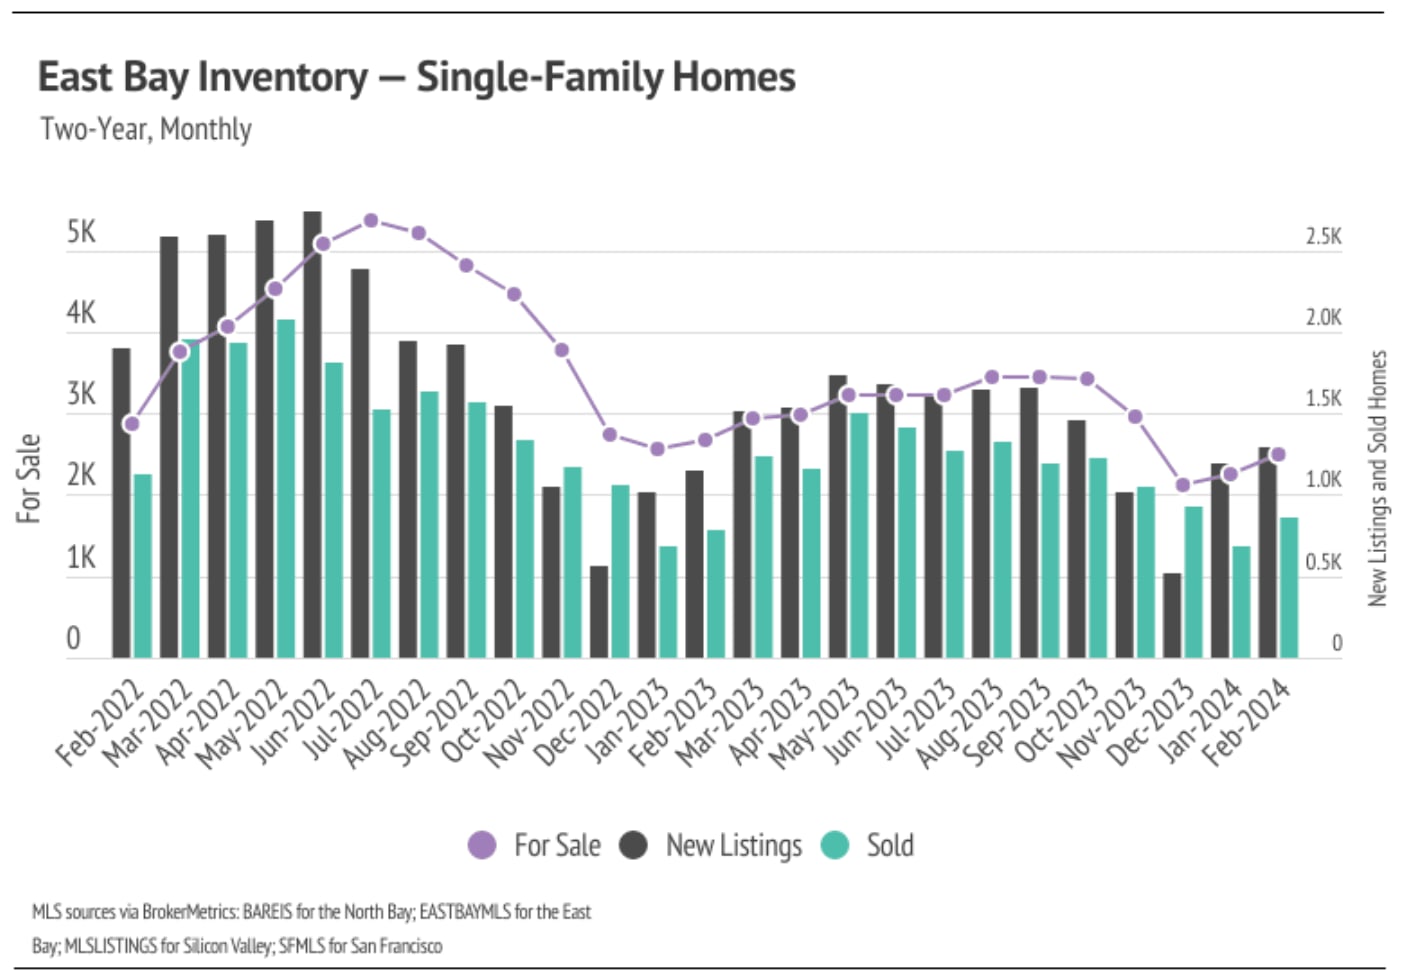
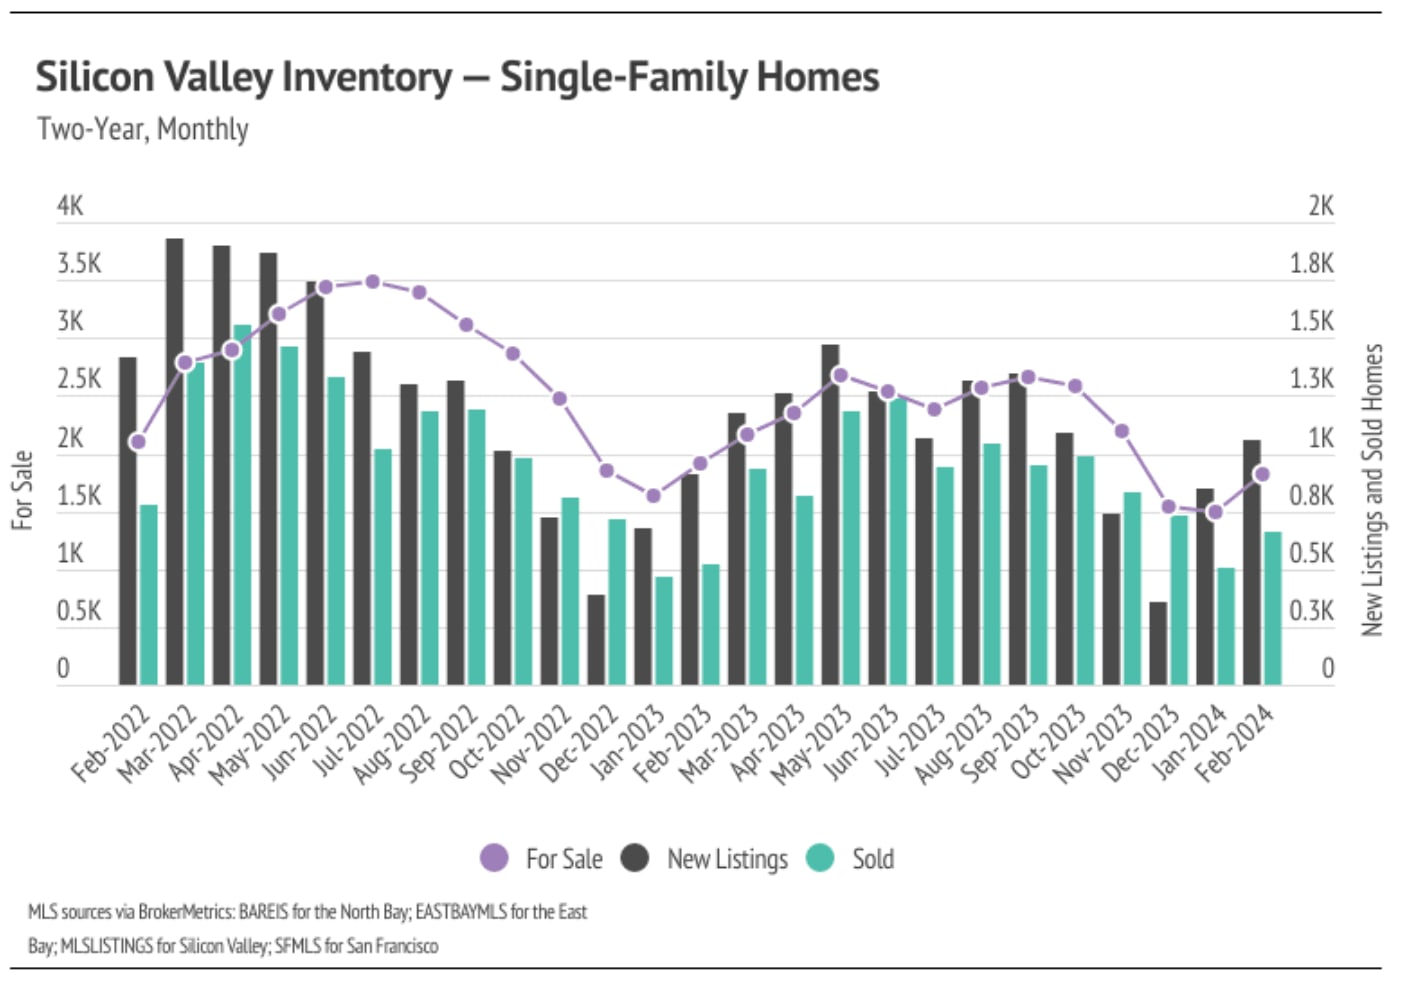
Since the start of 2023, single-family home inventory has followed fairly typical seasonal trends, but at significantly depressed levels. Low inventory and fewer new listings have slowed the market considerably. Typically, inventory peaks in July or August and declines through December or January, but the lack of new listings prevented meaningful inventory growth. Last year, sales and new listings peaked in May, while inventory peaked in September. New listings have been exceptionally low, so the little inventory growth in 2023 was driven by softening demand.
In January 2024, new listings rose significantly, which translated into more sales in February. With the current low inventory levels, the number of new listings coming to market is a significant predictor of sales. The next three months will be critical to our understanding of the market. More supply will mean a healthier market and a more normal housing market in 2024. Notably, San Francisco inventory was the one outlier in the Bay Area, reaching a record low level in February for the third month in a row.
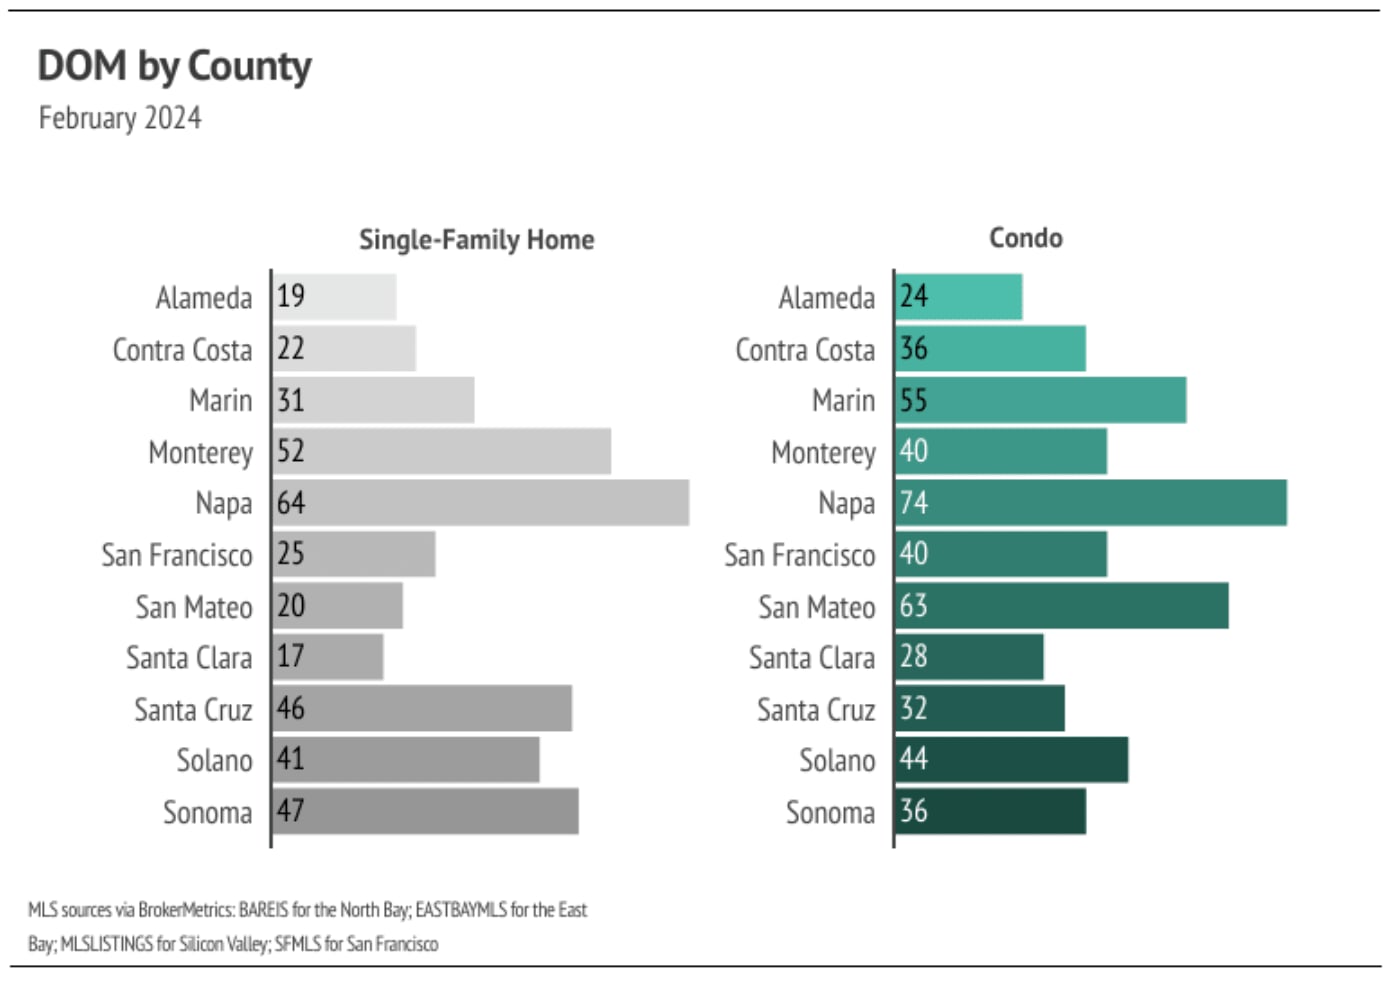
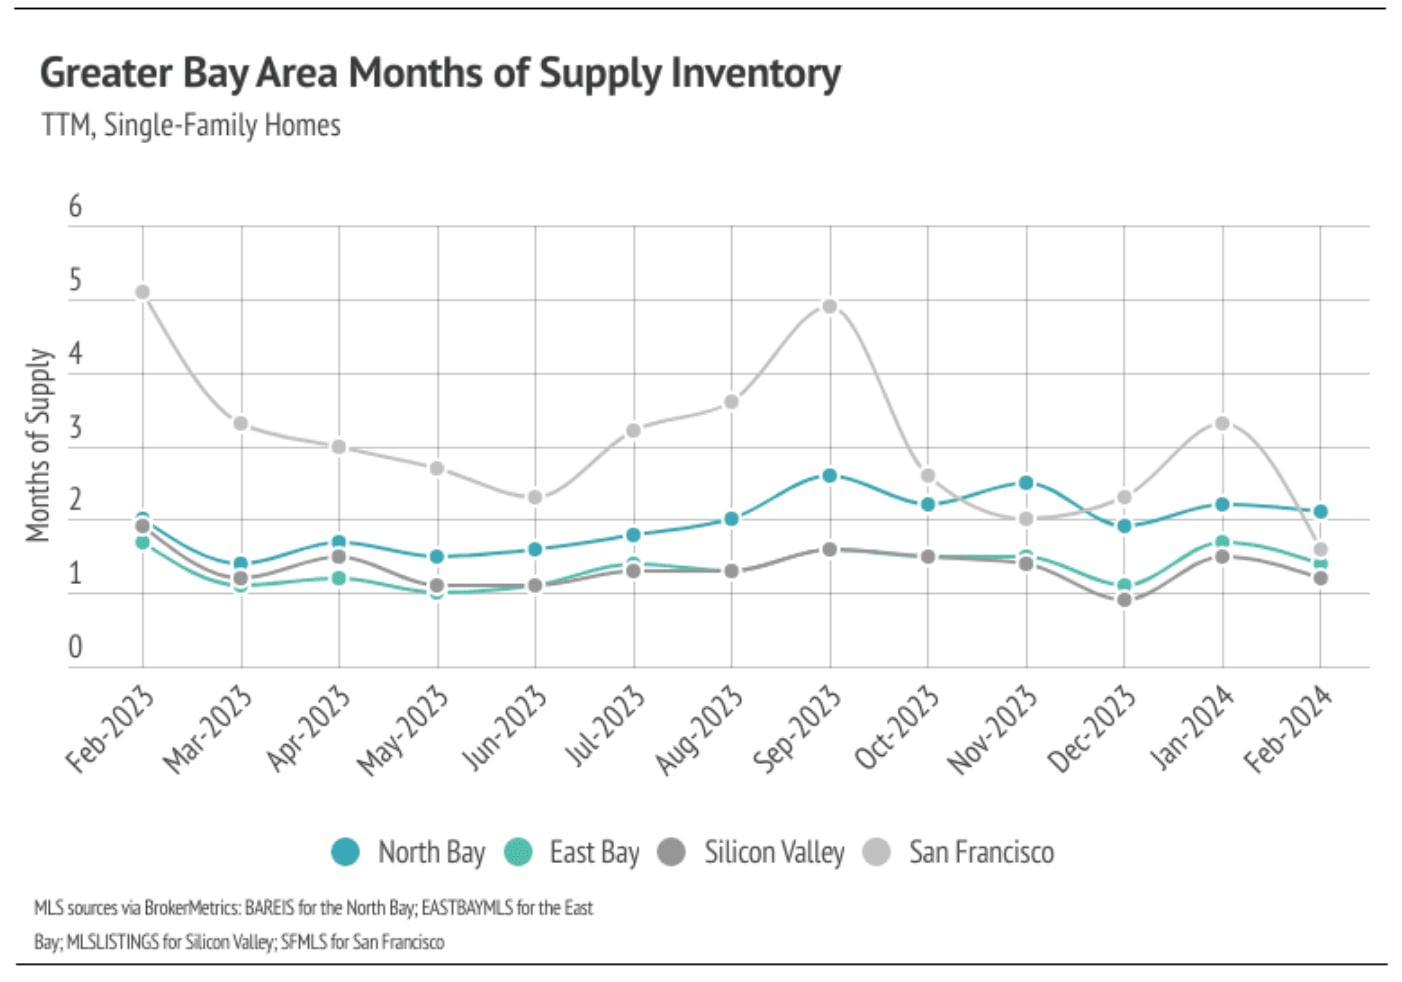
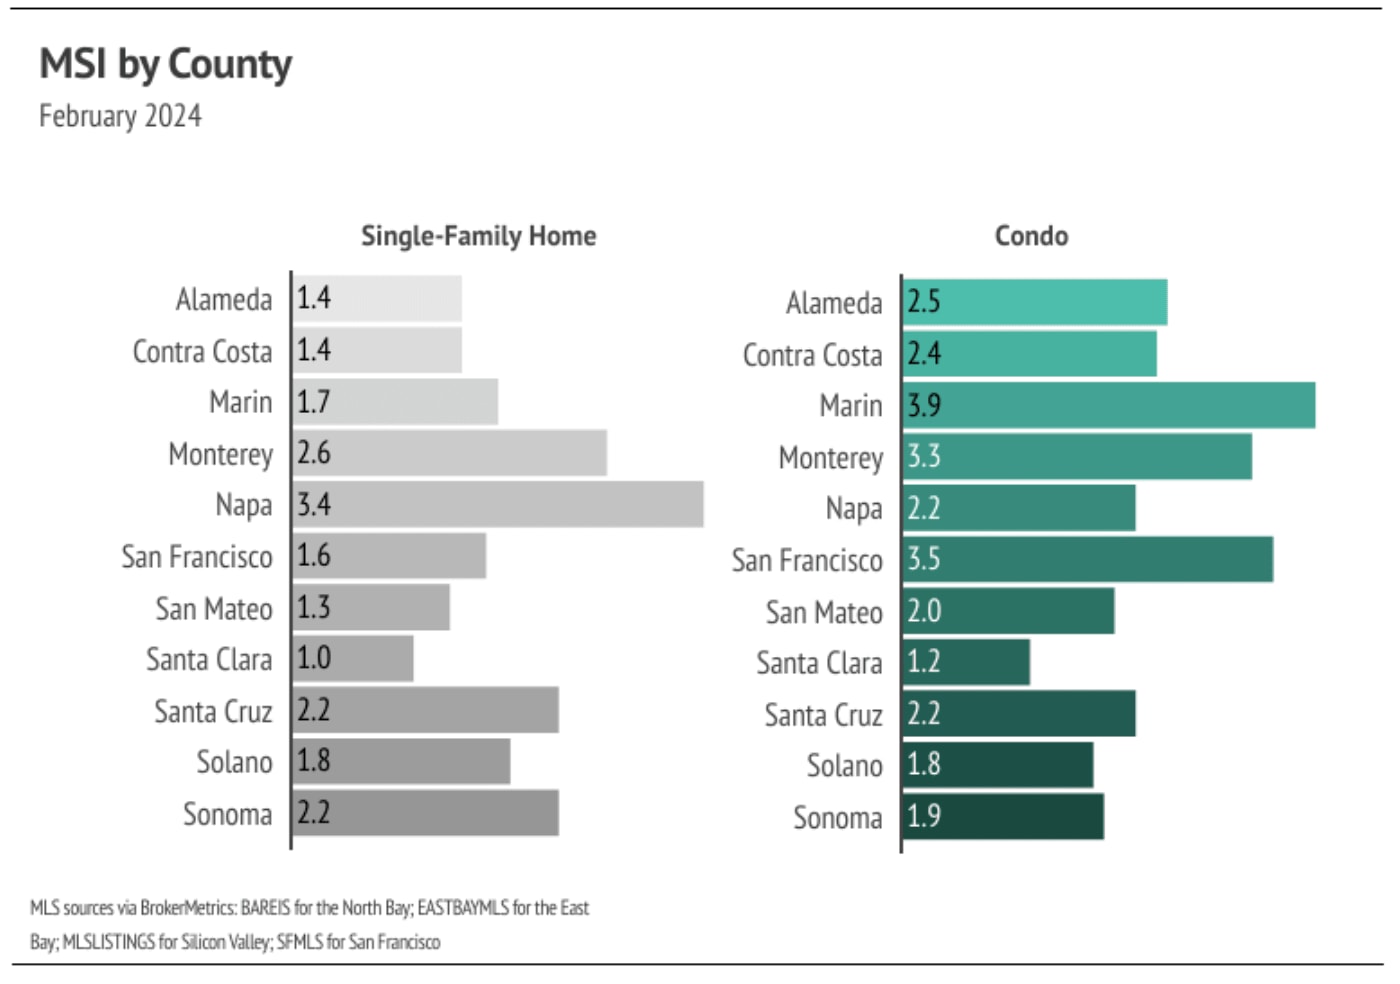
Months of Supply Inventory in February 2024 indicated a sellers’ market
Months of Supply Inventory (MSI) quantifies the supply/demand relationship by measuring how many months it would take for all current homes listed on the market to sell at the current rate of sales. The long-term average MSI is around three months in California, which indicates a balanced market. An MSI lower than three indicates that there are more buyers than sellers on the market (meaning it’s a sellers’ market), while a higher MSI indicates there are more sellers than buyers (meaning it’s a buyers’ market). The Bay Area markets tend to favor sellers, which is reflected in their low MSIs. San Francisco MSI is notable for its variability over the past year, oscillating from buyers’ to sellers’ markets twice over the course of 12 months. Currently, single-family home MSI is below three months of supply (a sellers’ market) in every Bay Area county except for single-family homes in Napa and condos in Marin and Monterey, which are now balanced.
We can also use percent of list price received as another indicator for supply and demand. Typically, in a calendar year, sellers receive the lowest percentage of list price during the winter months, when demand is lowest. January tends to have the lowest average sale price (SP) to list price (LP), and the summer months tend to have the highest SP/LP. The January and February 2024 SP/LP was higher than last year across the Bay Area, meaning we expect sellers overall to receive a higher percentage of the list price in 2024 than they did in 2023.