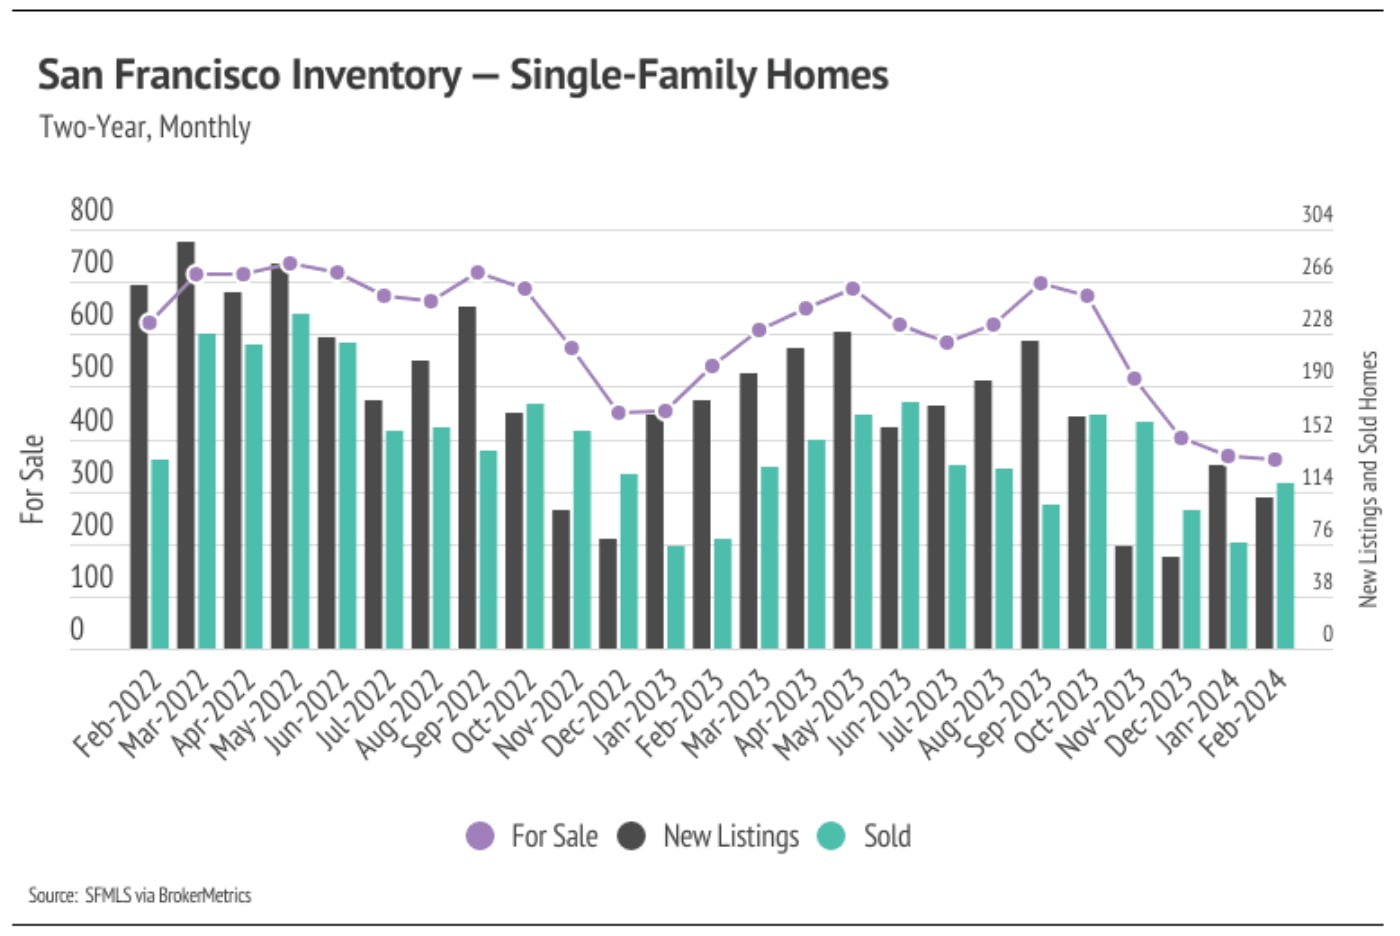
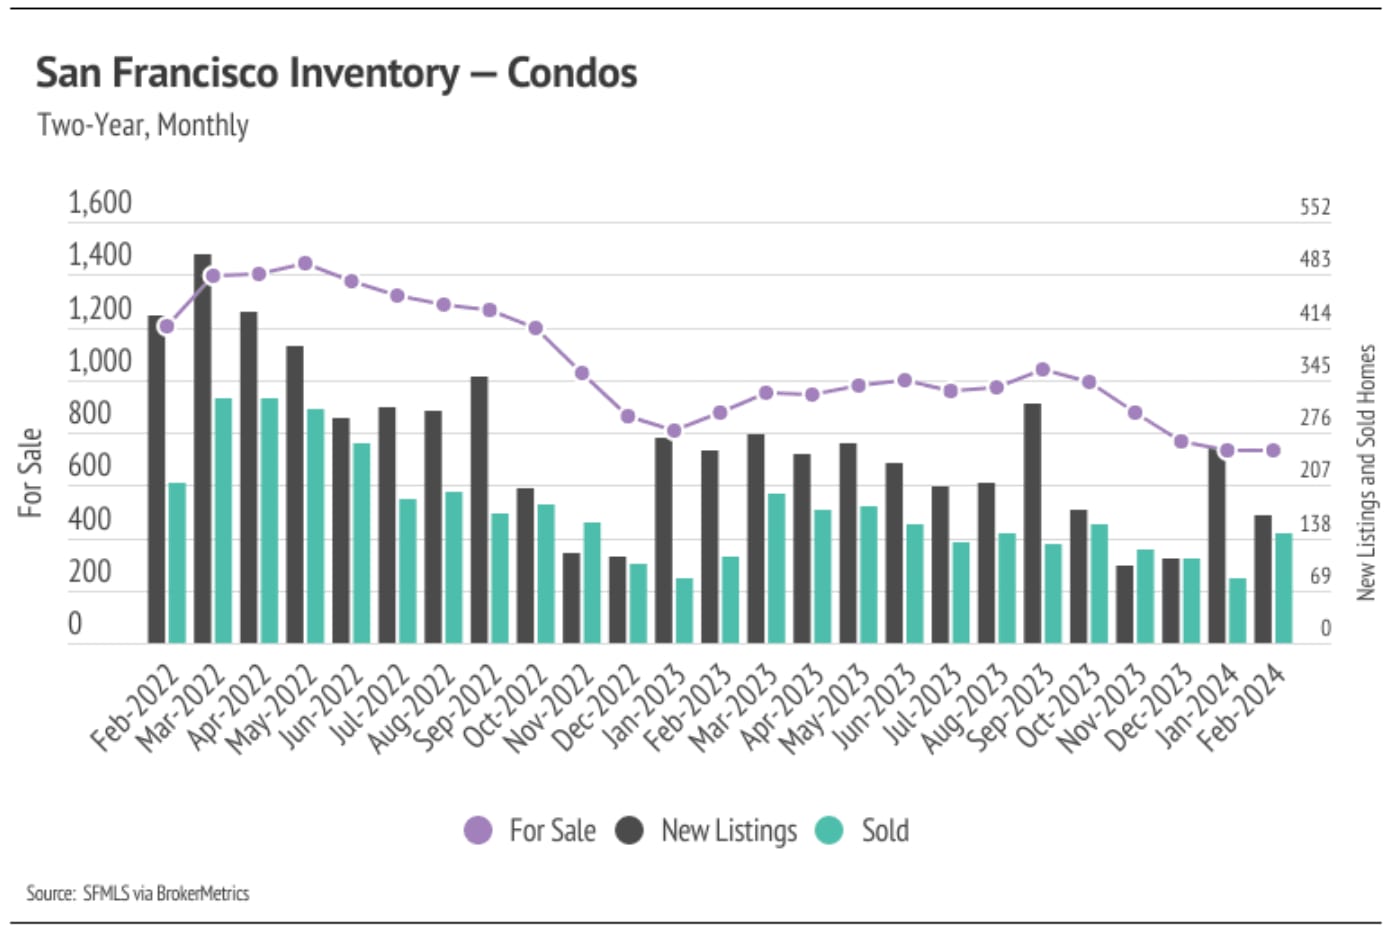
Since the start of 2023, single-family home inventory has followed fairly typical seasonal trends, but at a significantly depressed level, while condo inventory has been in decline since May 2022. Low inventory and fewer new listings have slowed the market considerably. Typically, inventory peaks in July or August and declines through December or January, but the lack of new listings prevented meaningful inventory growth. Last year, sales peaked in May, while new listings and inventory peaked in September. New listings have been exceptionally low, so the little inventory growth throughout the year was driven by fewer sales. In November and December, new listings dropped significantly without a proportional drop in sales, causing inventory to fall to an all-time low, which further highlights how unusual inventory patterns have been over the past year. However, in January 2024, new listings rose nearly 115% month over month after hitting a record low number of new listings coming to market in December. New listings still couldn’t keep up with sales in January, however, and inventory declined further.
New listings in January led to a 64% sales increase in February. With the current low inventory levels, the number of new listings coming to market is a significant predictor of sales. Year over year, inventory is down 22%; however, sales are up 37%. The next three months will be critical to our understanding of the market. More supply will mean a healthier market and a more normal housing market in 2024.
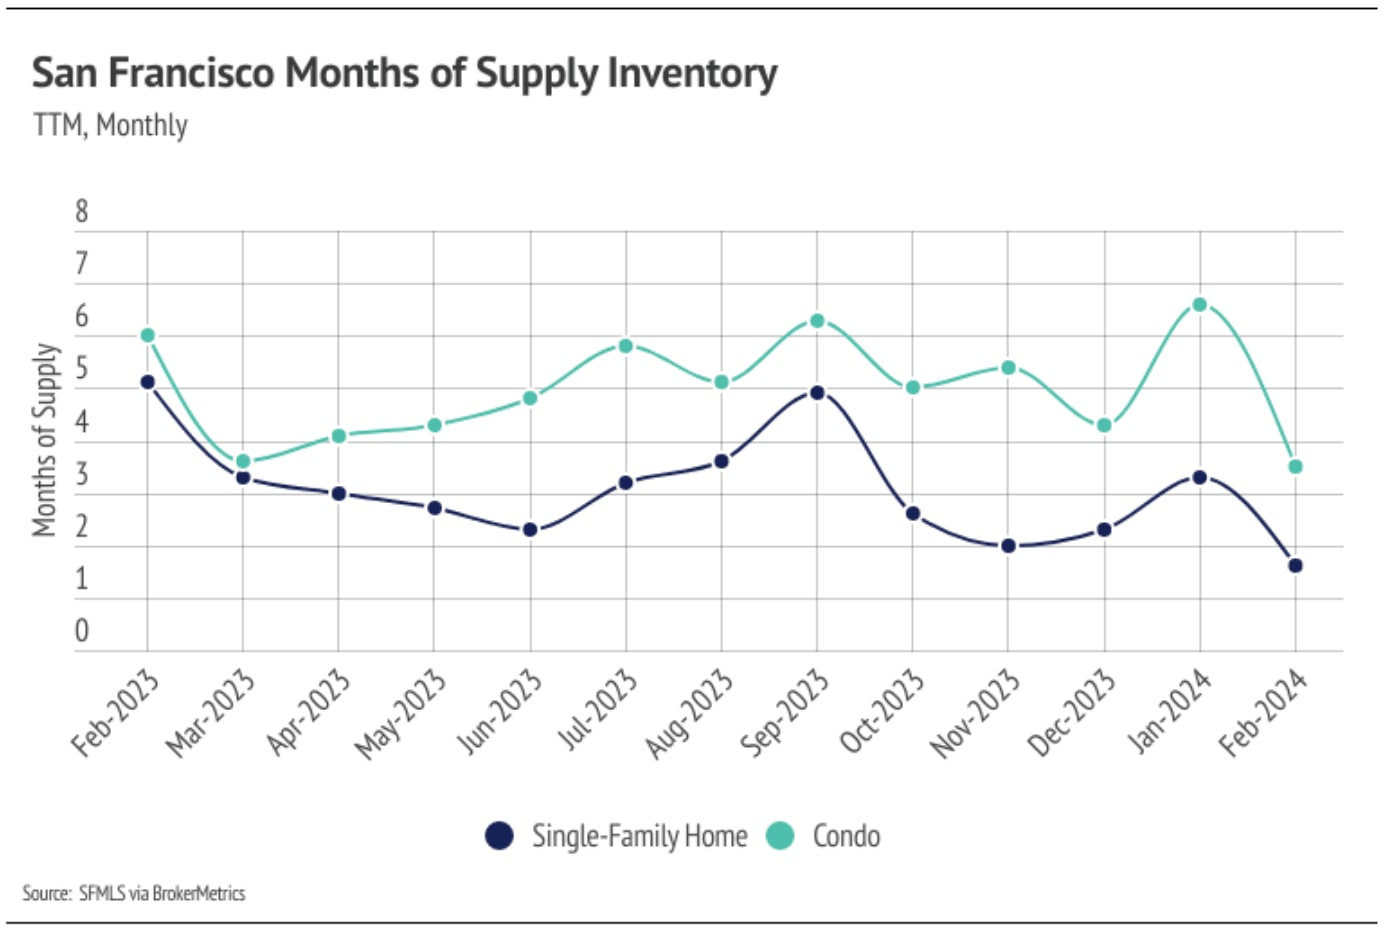
Months of Supply Inventory in February 2024 indicated a sellers’ market
Months of Supply Inventory (MSI) quantifies the supply/demand relationship by measuring how many months it would take for all current homes listed on the market to sell at the current rate of sales. The long-term average MSI is around three months in California, which indicates a balanced market. An MSI lower than three indicates that there are more buyers than sellers on the market (meaning it’s a sellers’ market), while a higher MSI indicates there are more sellers than buyers (meaning it’s a buyers’ market).The San Francisco market tends to favor sellers, at least for single-family homes, which is reflected in its low MSI. However, we’ve seen over the past 12 months that this isn’t always the case. MSI has been volatile, moving between a buyers’ and sellers’ market throughout the year. In February, MSI declined, indicating that single-family homes shifted from balanced to favoring sellers, and condos moved from favoring buyers to balanced.
We can also use percent of list price received as another indicator for supply and demand. Typically, in a calendar year, sellers receive the lowest percentage of list price during the winter months, when demand is lowest. Winter months tend to have the lowest average sale price (SP) to list price (LP), and the summer months tend to have the highest SP/LP. The February 2024 SP/LP was 4% higher than last year, meaning we expect sellers overall to receive a higher percentage of the list price throughout all of 2024 than they did in 2023.