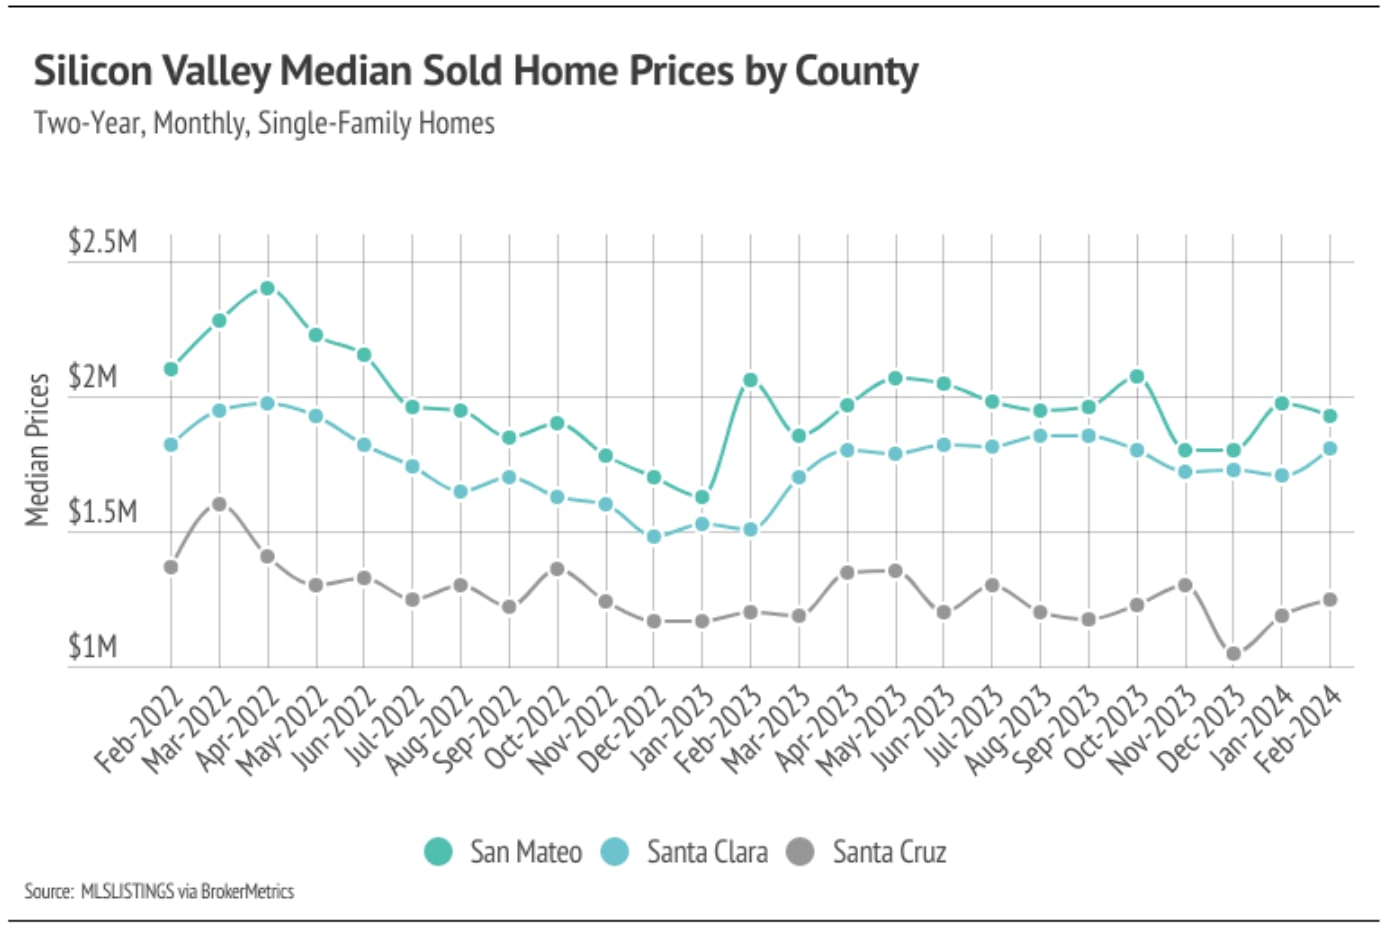
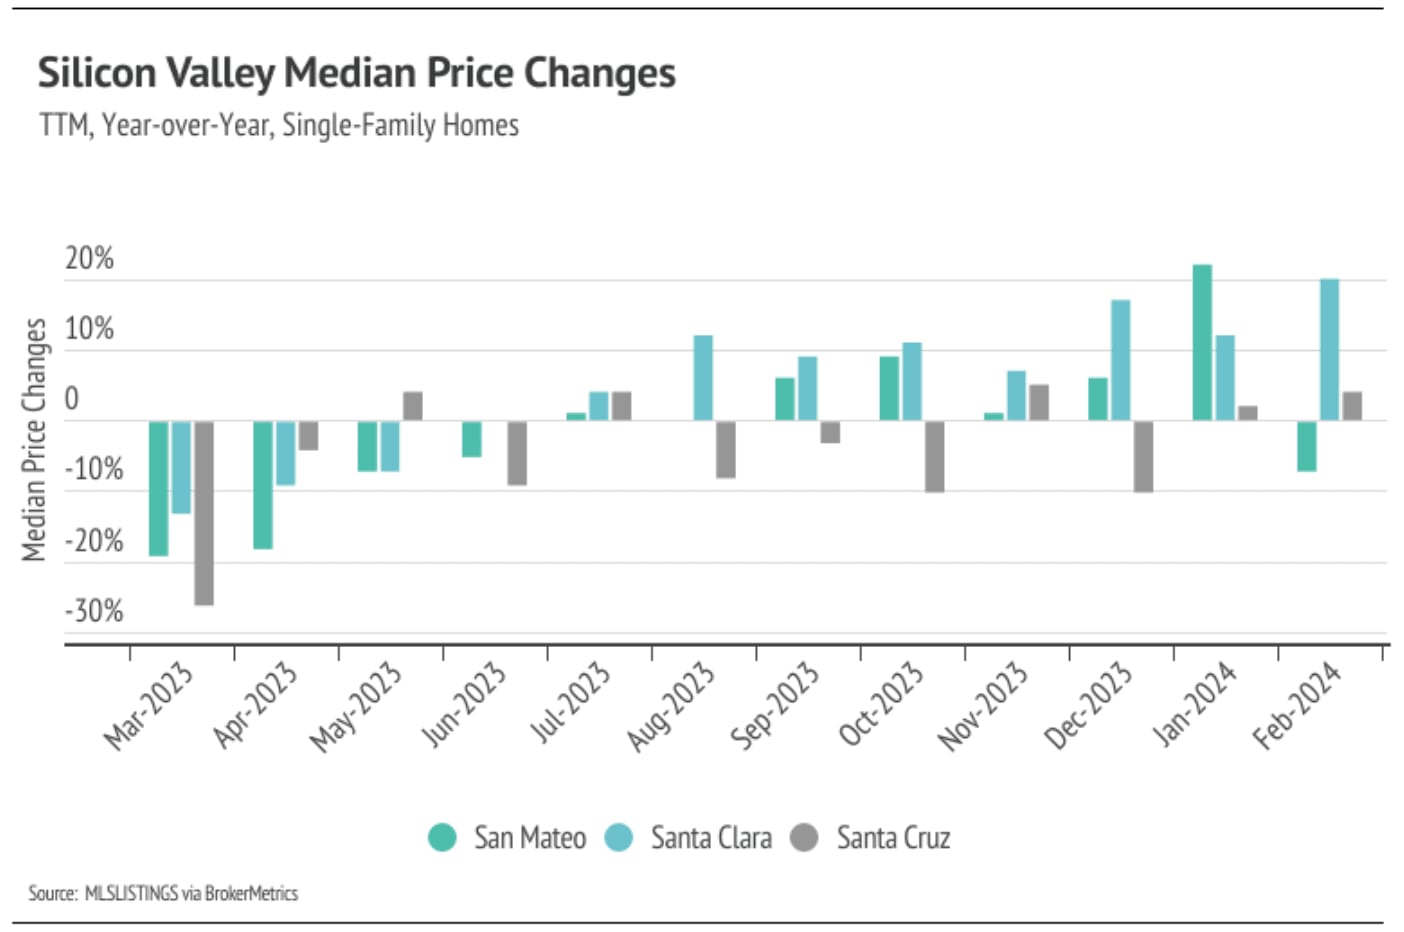
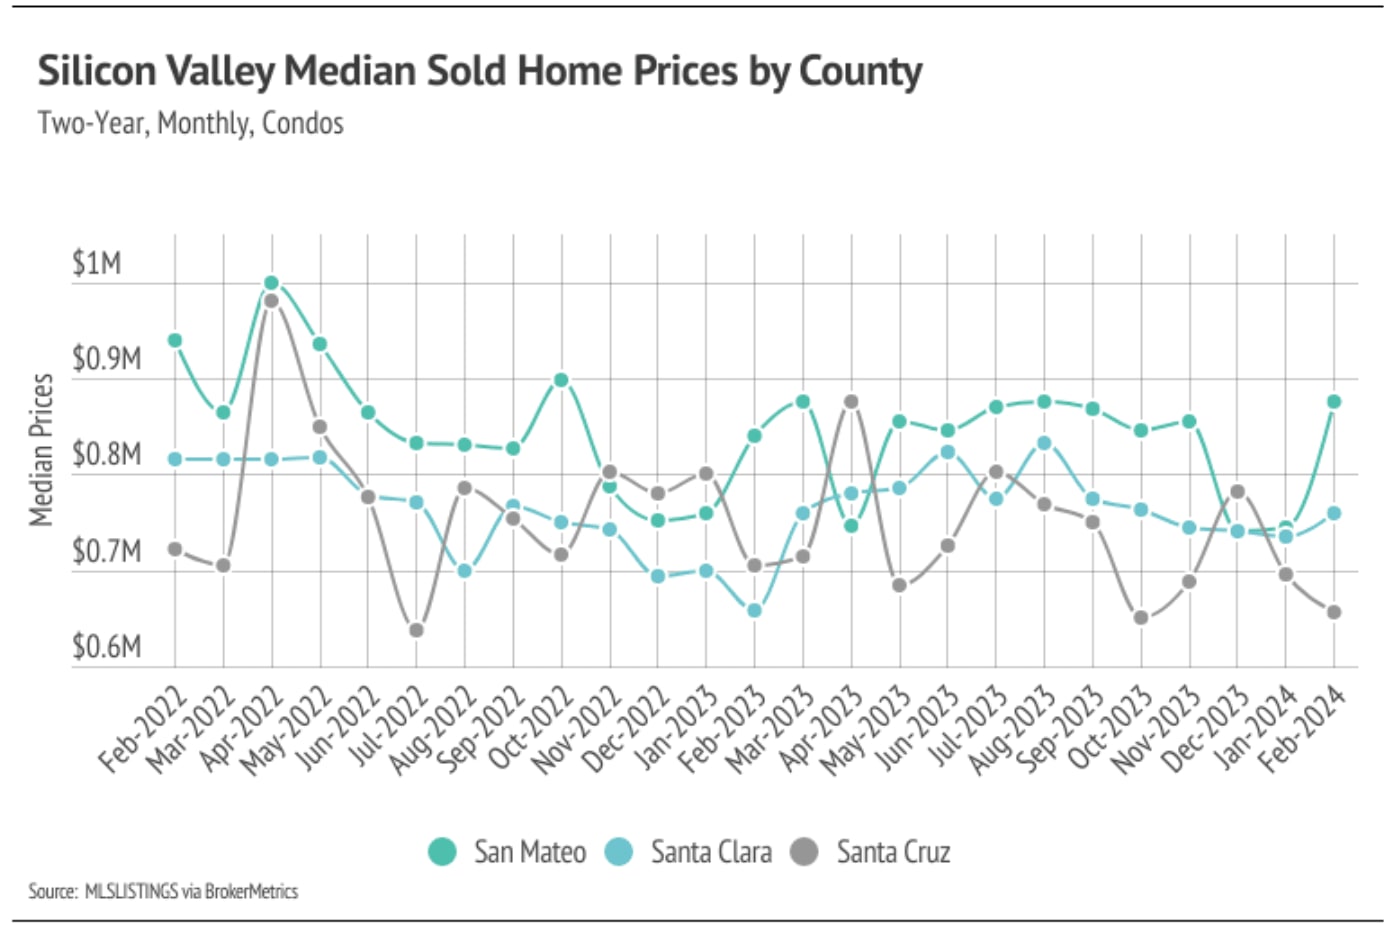
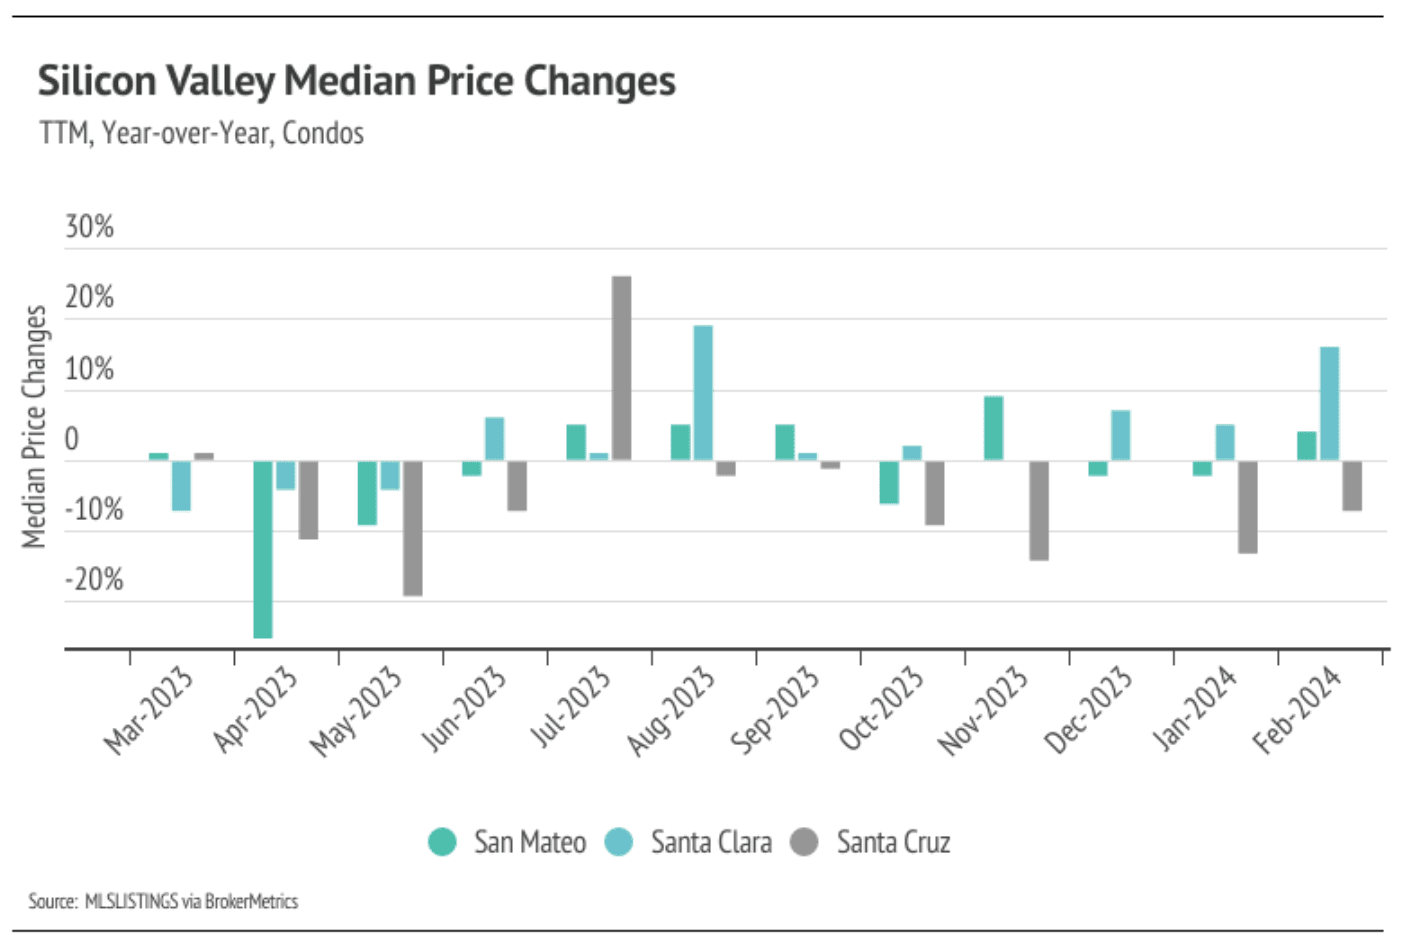
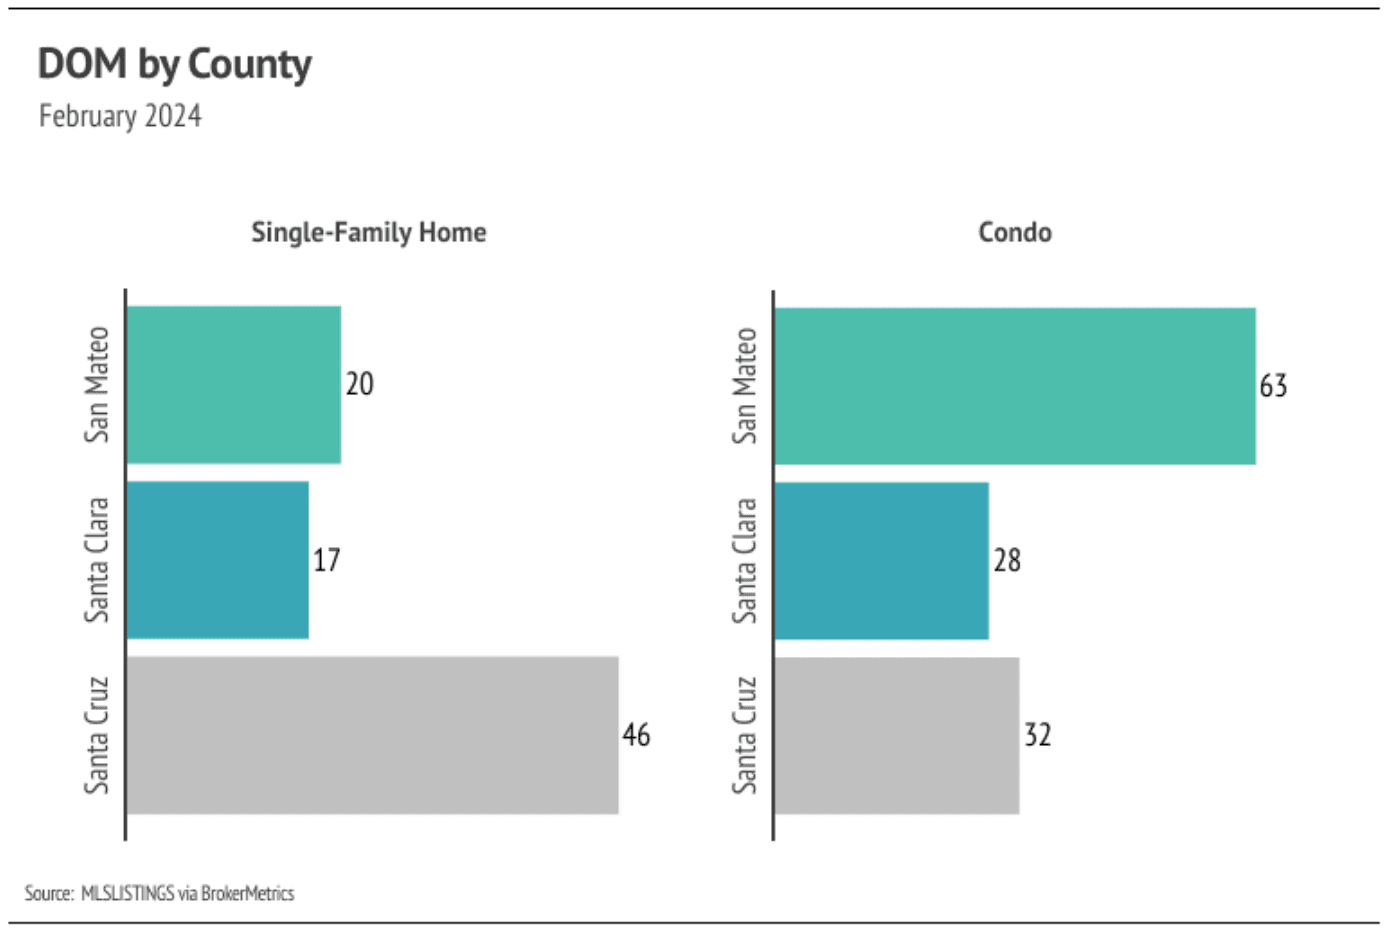
In Silicon Valley, low inventory and high demand have more than offset the downward price pressure from higher mortgage rates, and prices generally haven’t experienced larger drops due to higher mortgage rates. Month over month, in February, the median single-family home price fell 3% in San Mateo, but rose 5% in both Santa Clara and Santa Cruz. However, year over year, prices were down 7% in San Mateo, while Santa Clara and Santa Cruz prices were up 20% and 4%, respectively. Condo prices were mixed across Silicon Valley both month over month and year over year. We expect prices in Silicon Valley to remain slightly below peak until late spring, but as interest rates decline, prices will almost certainly reach new highs in the first half of 2024 with the exception of single-family homes in San Mateo, where prices are far below peak. Additionally, inventory is so low that rising supply will only increase prices as buyers are better able to find the best match.
High mortgage rates soften both supply and demand, but at this point rates have been above 6% for 15 months, and rate cuts will likely occur sometime this year. Potential buyers have had longer to save for a down payment and will have the opportunity to refinance in the next 12-24 months, which makes current rates less of a limiting factor. However, high demand can only do so much for the market if there isn’t supply to meet it.
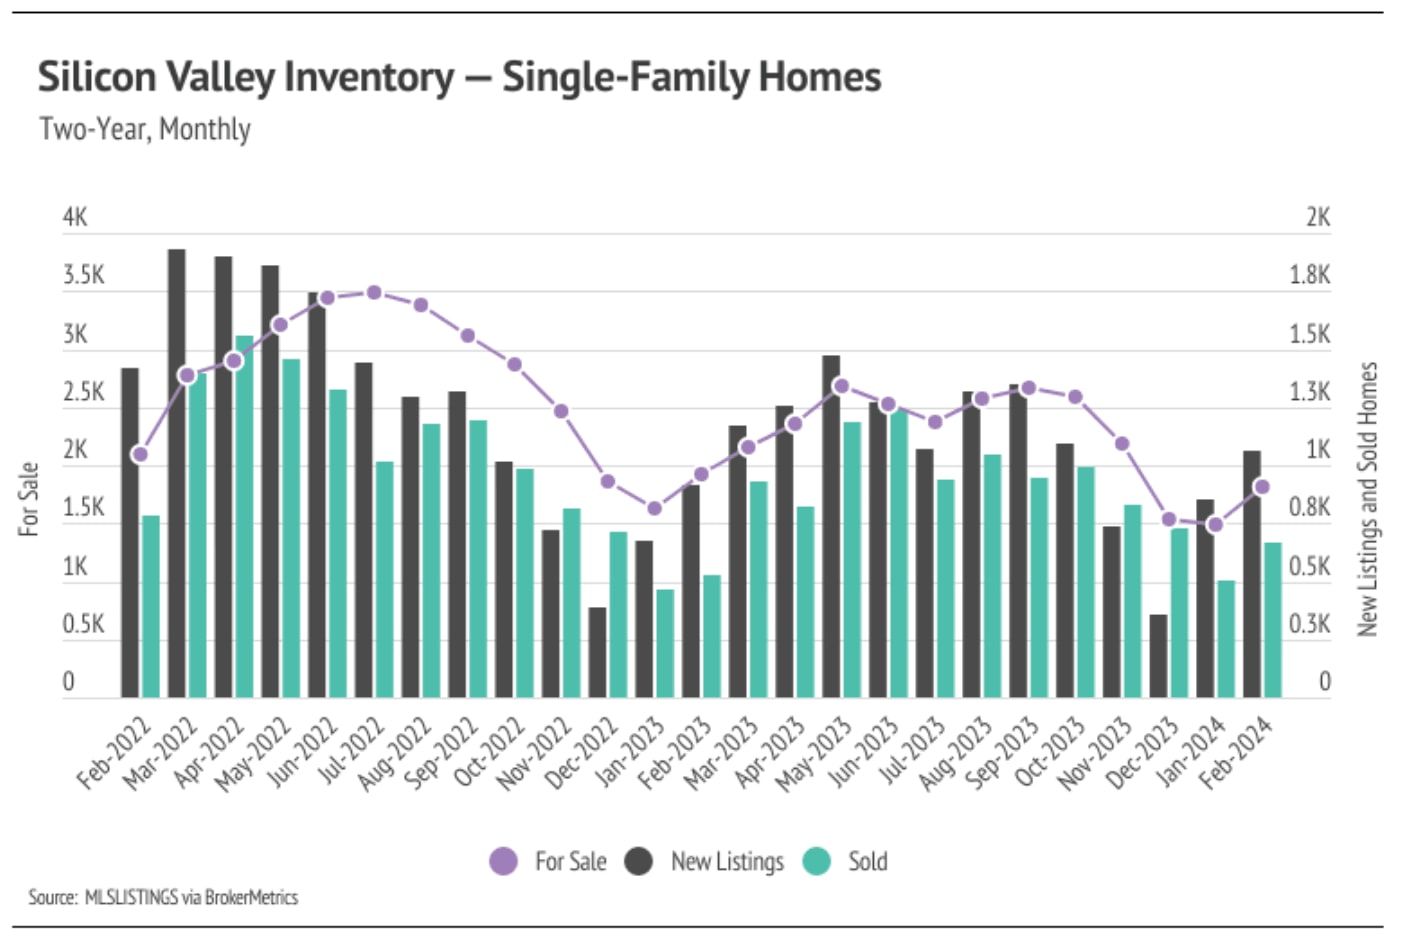
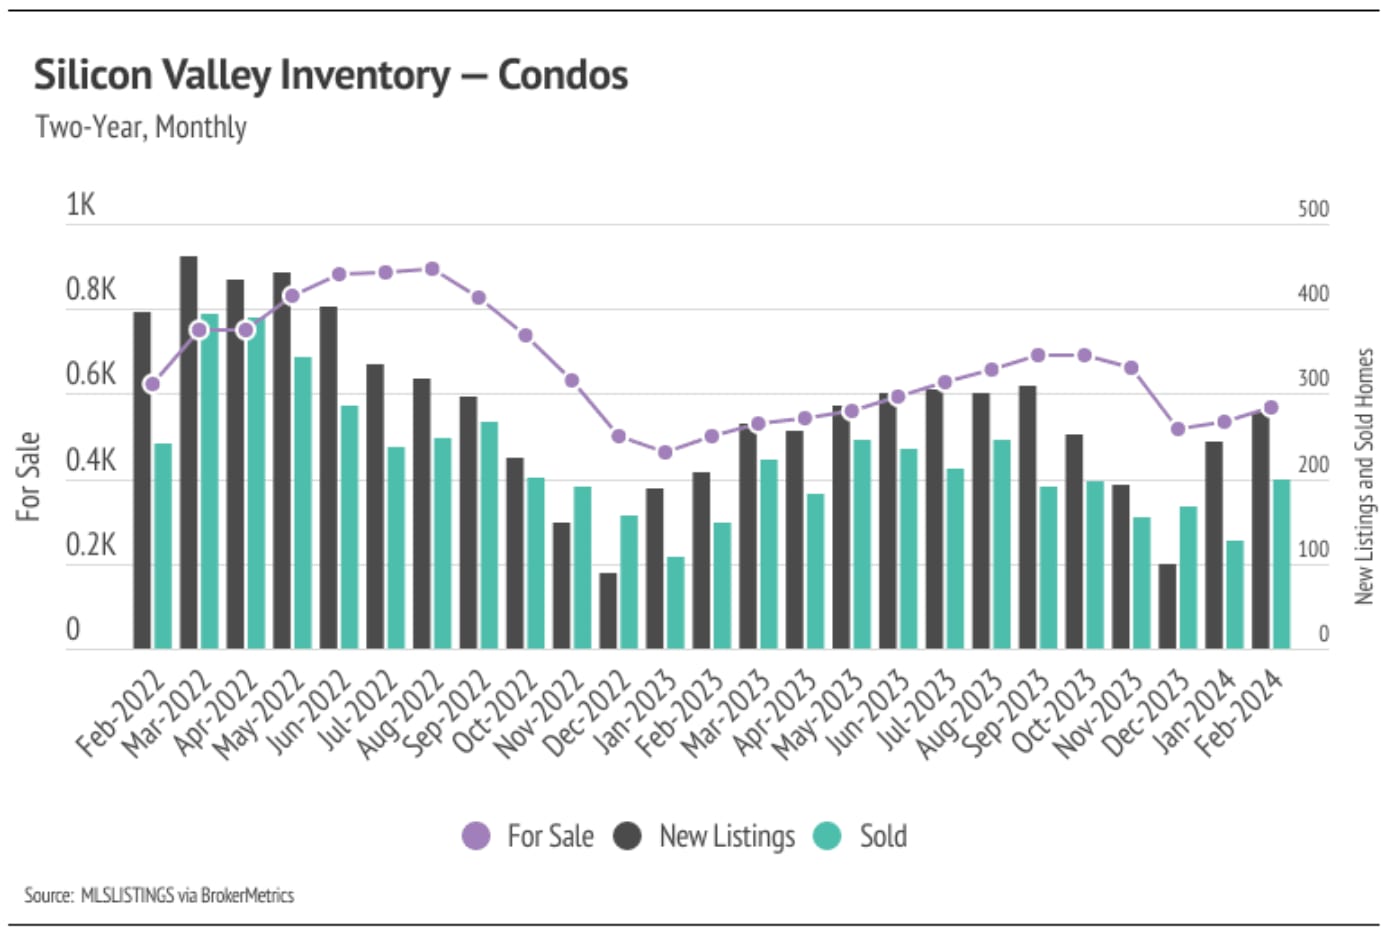
Single-family home and condo inventory, sales, and new listings increased month over month
Single-family home and condo inventory barely increased at all last year, which is far from the seasonal norm. In 2023, inventory didn’t have anything resembling the typical sine wave, since far fewer sellers came to the market, especially in the first half of the year, and the low inventory and fewer new listings slowed the market considerably. New listings were exceptionally low, so the little inventory growth last year was driven by softening demand. Typically, inventory peaks in July or August and declines through December or January. However, in 2023, inventory peaked in September, further highlighting the atypical supply trend. During Q4 2023, inventory, sales, and new listings dropped.
Inventory and new listings increased significantly in the first two months of 2024. With the current low inventory levels, the number of new listings coming to market is a significant predictor of sales. New listings increased 22% month over month, and sales increased 36%. Year over year, inventory is down 1%; however, sales and new listings are up 29% and 19%, respectively. The next three months will be critical to our understanding of the market. More supply will mean a healthier market and a more normal housing market in 2024.
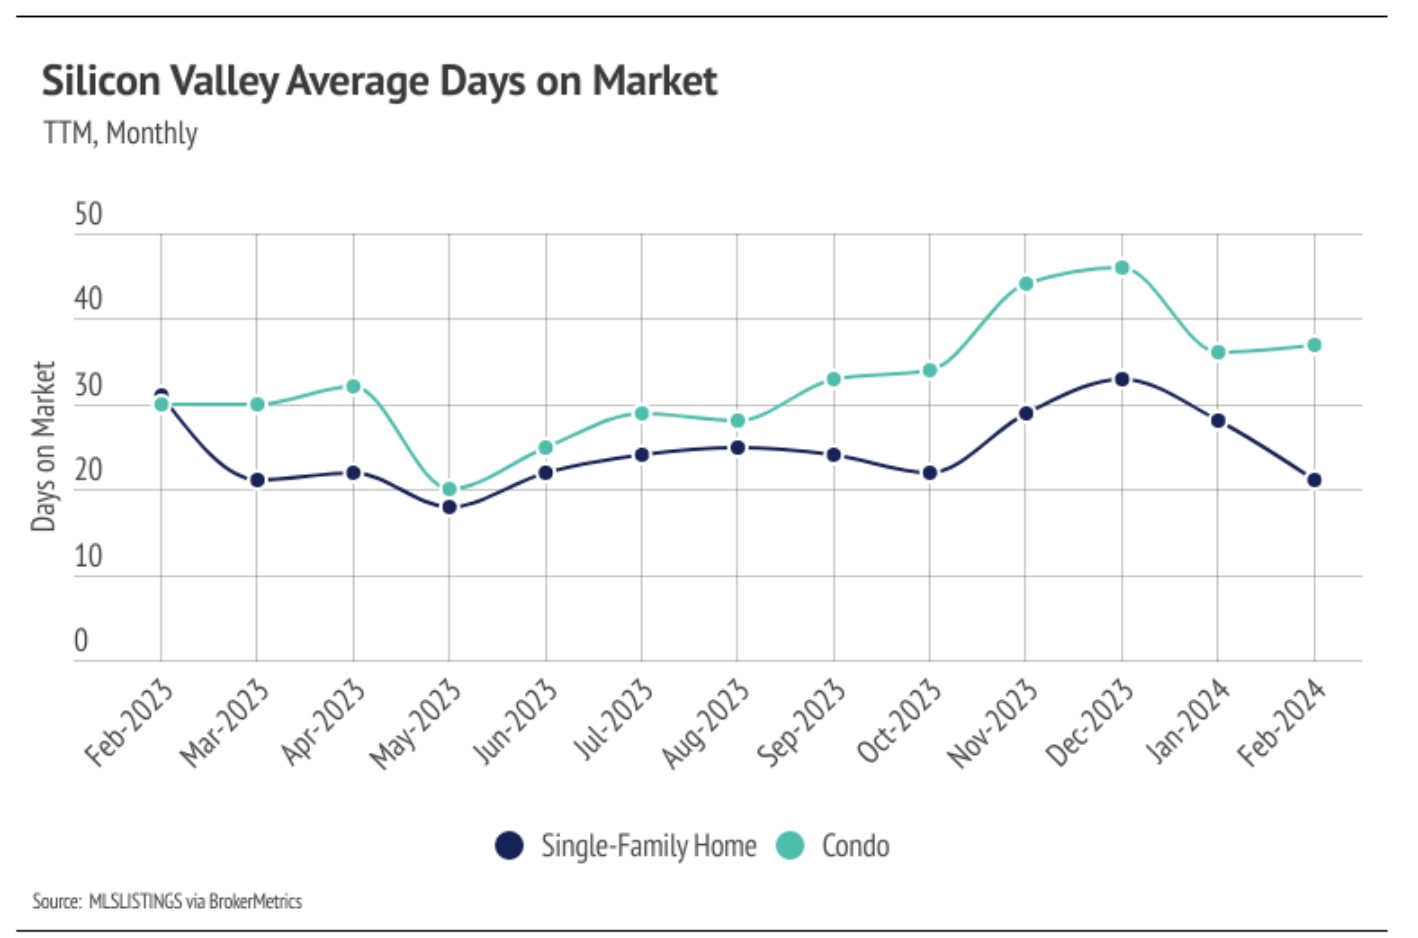
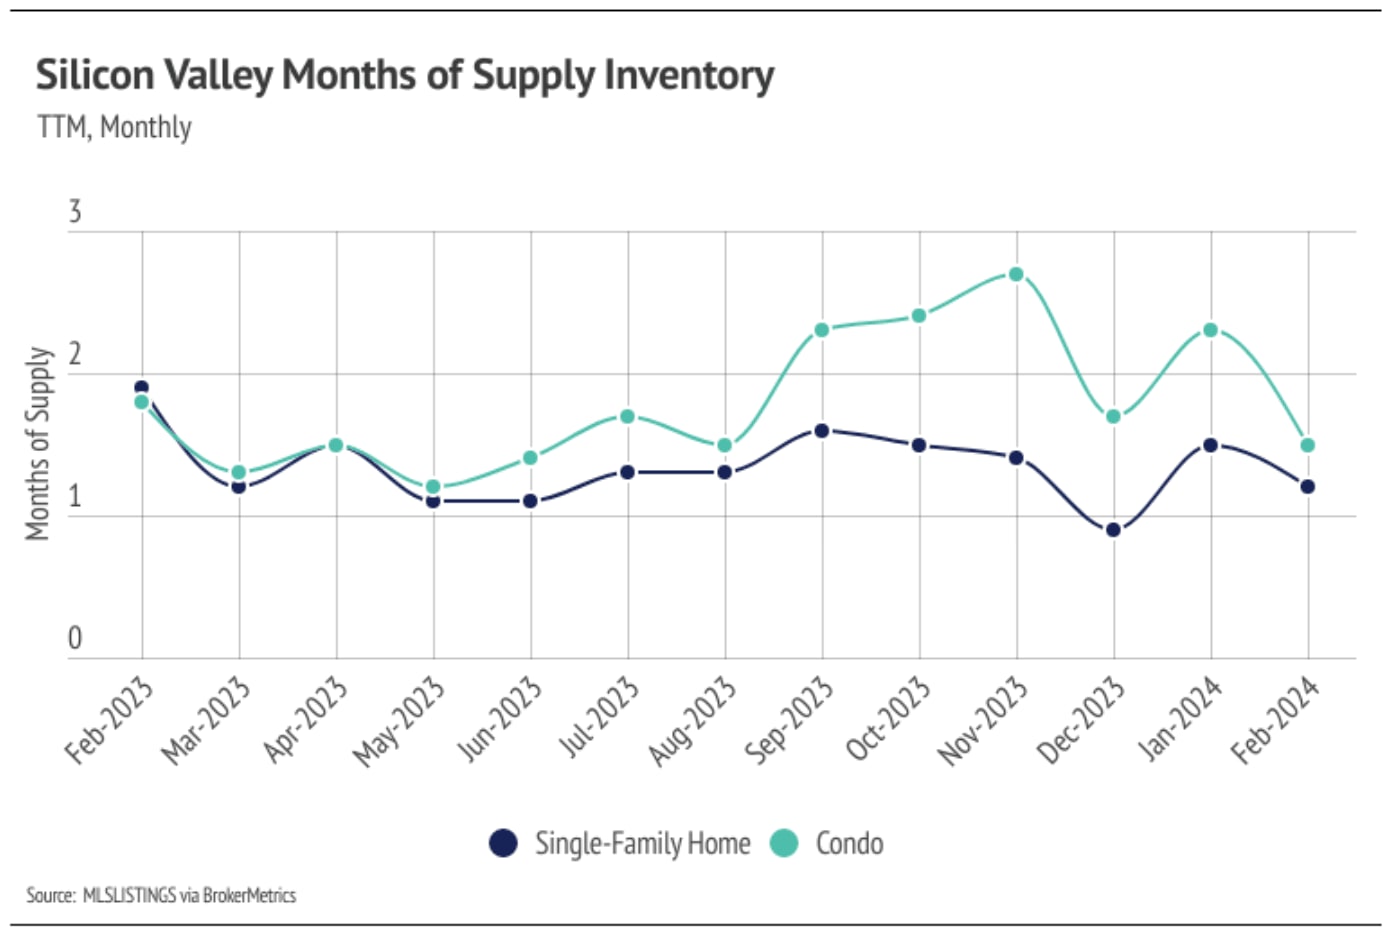
Months of Supply Inventory in February 2024 indicated a sellers’ market
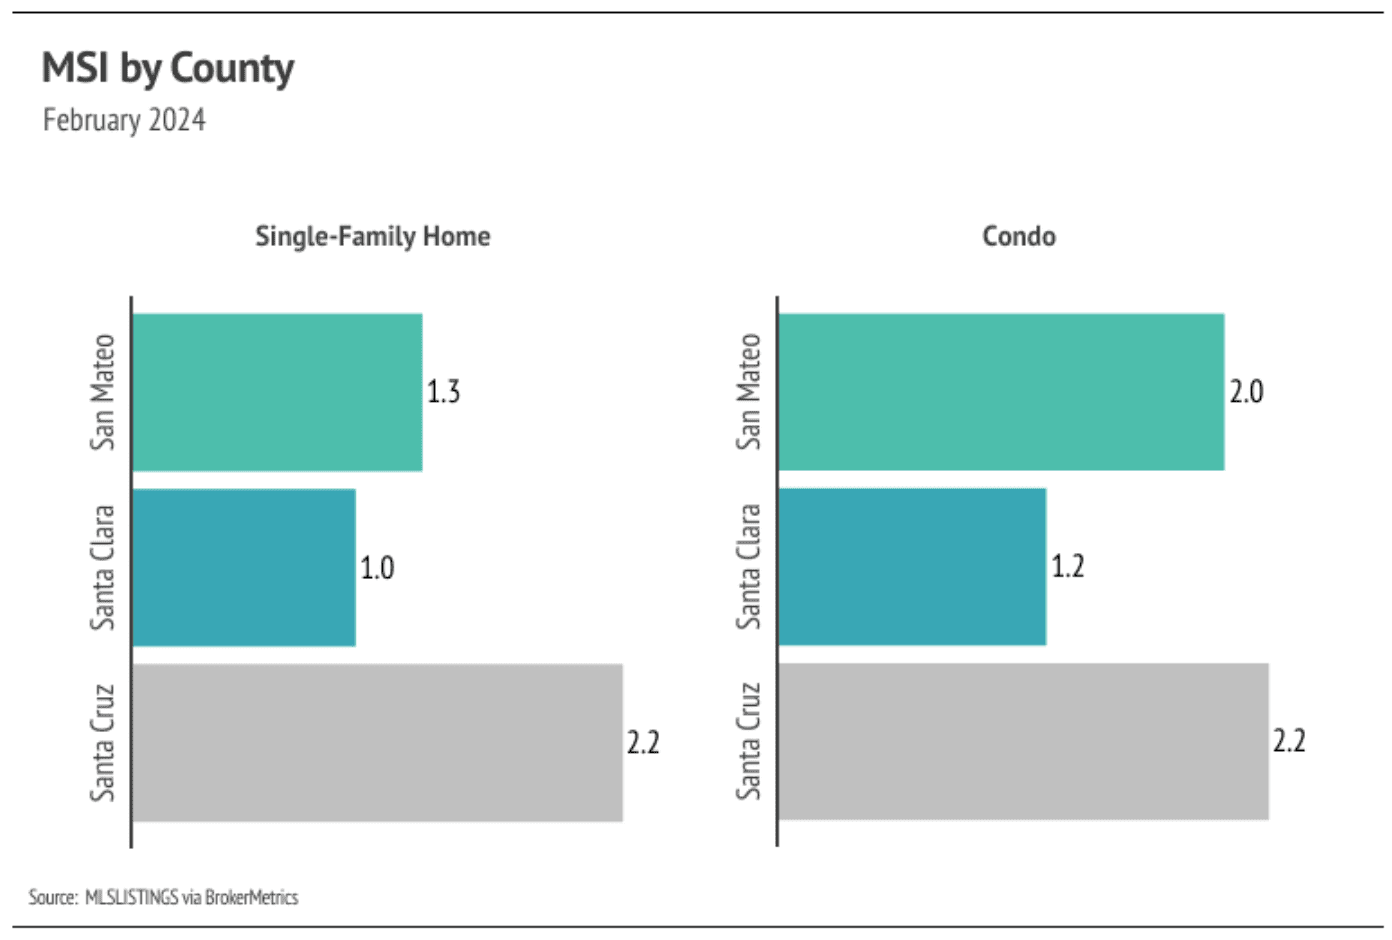
Months of Supply Inventory (MSI) quantifies the supply/demand relationship by measuring how many months it would take for all current homes listed on the market to sell at the current rate of sales. The long-term average MSI is around three months in California, which indicates a balanced market. An MSI lower than three indicates that there are more buyers than sellers on the market (meaning it’s a sellers’ market), while a higher MSI indicates there are more sellers than buyers (meaning it’s a buyers’ market). The Silicon Valley market tends to favor sellers, which is reflected in its low MSI. MSI fell sharply in the first quarter of 2023 before gently trending higher from May to November. In December, MSI declined sharply, but rose again in January. MSI contracted once again in February and currently indicates a sellers’ market for both single-family homes and condos.
We can also use percent of list price received as another indicator for supply and demand. Typically, in a calendar year, sellers receive the lowest percentage of list price during the winter months, when demand is lowest. Winter months tend to have the lowest average sale price (SP) to list price (LP), and the summer months tend to have the highest SP/LP. The January and February 2024 SP/LP were 5% and 6% higher than last year, respectively, meaning we expect sellers overall to receive a higher percentage of the list price throughout all of 2024 than they did in 2023.