The Local Lowdown: February 2024

Stay up to date on the latest real estate trends.

April 15, 2024
Exploring Retail Bliss: Unveiling Everything You Need To Know About Shopping in Richmond District.

April 15, 2024
Navigating Opportunities: Insights into the Richmond District San Francisco Real Estate Landscape.
Michelle Kim | April 1, 2024
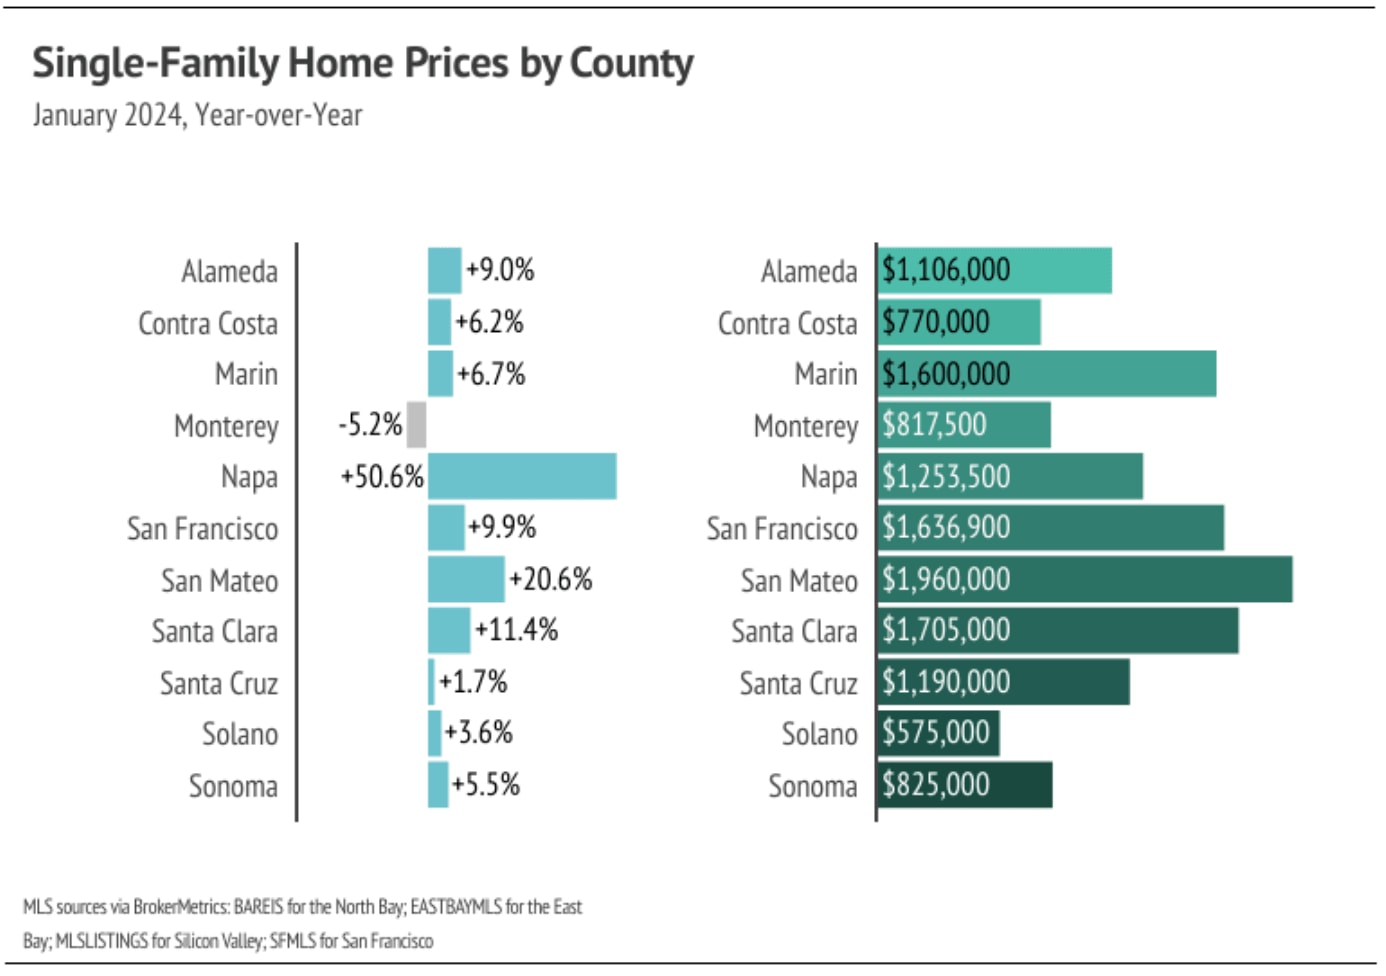
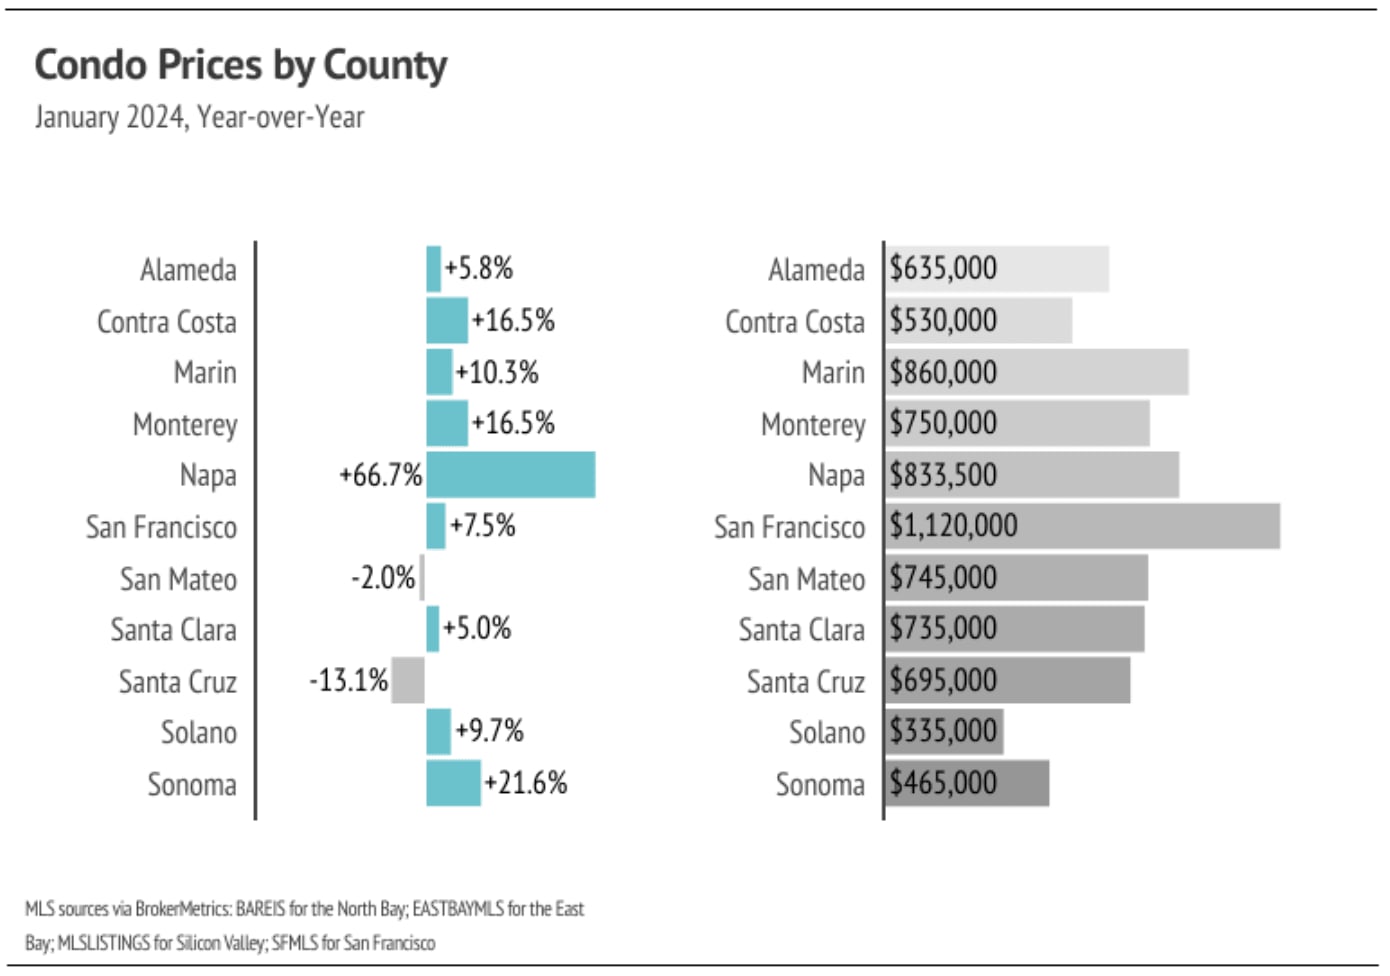
Quick Take: Year over year, the median single-family home and condo prices rose across most Bay Area counties in February. Low inventory and high mortgage rates have b… Read more

Michelle Kim | April 1, 2024
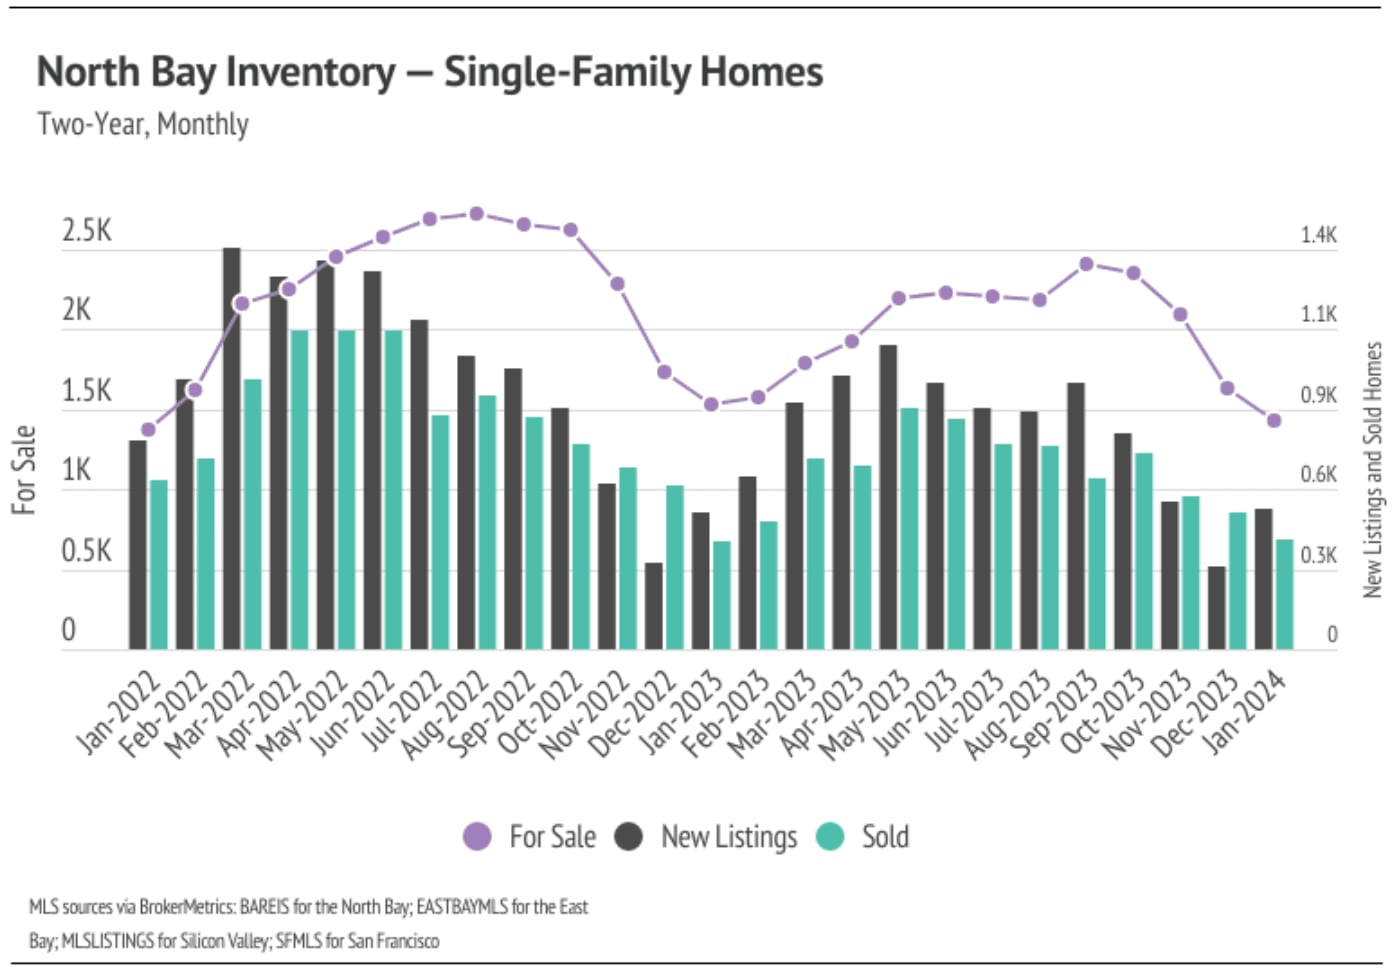
Quick Take: Median home prices are slightly below peak levels across the North Bay with the exception of single-family homes in Marin, which are far below peak. We exp… Read more

Michelle Kim | April 1, 2024
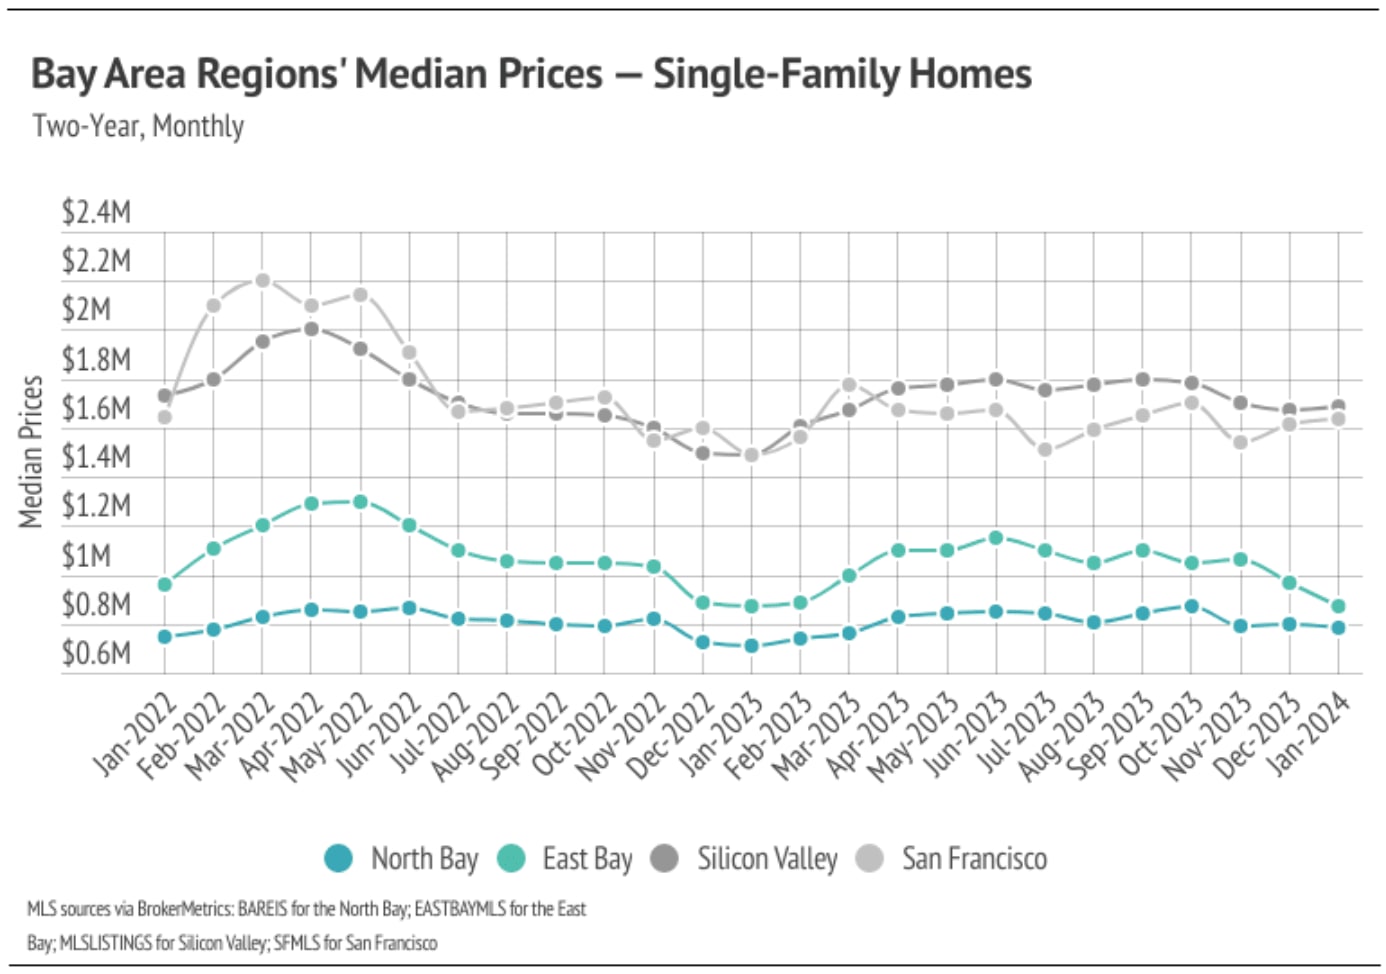
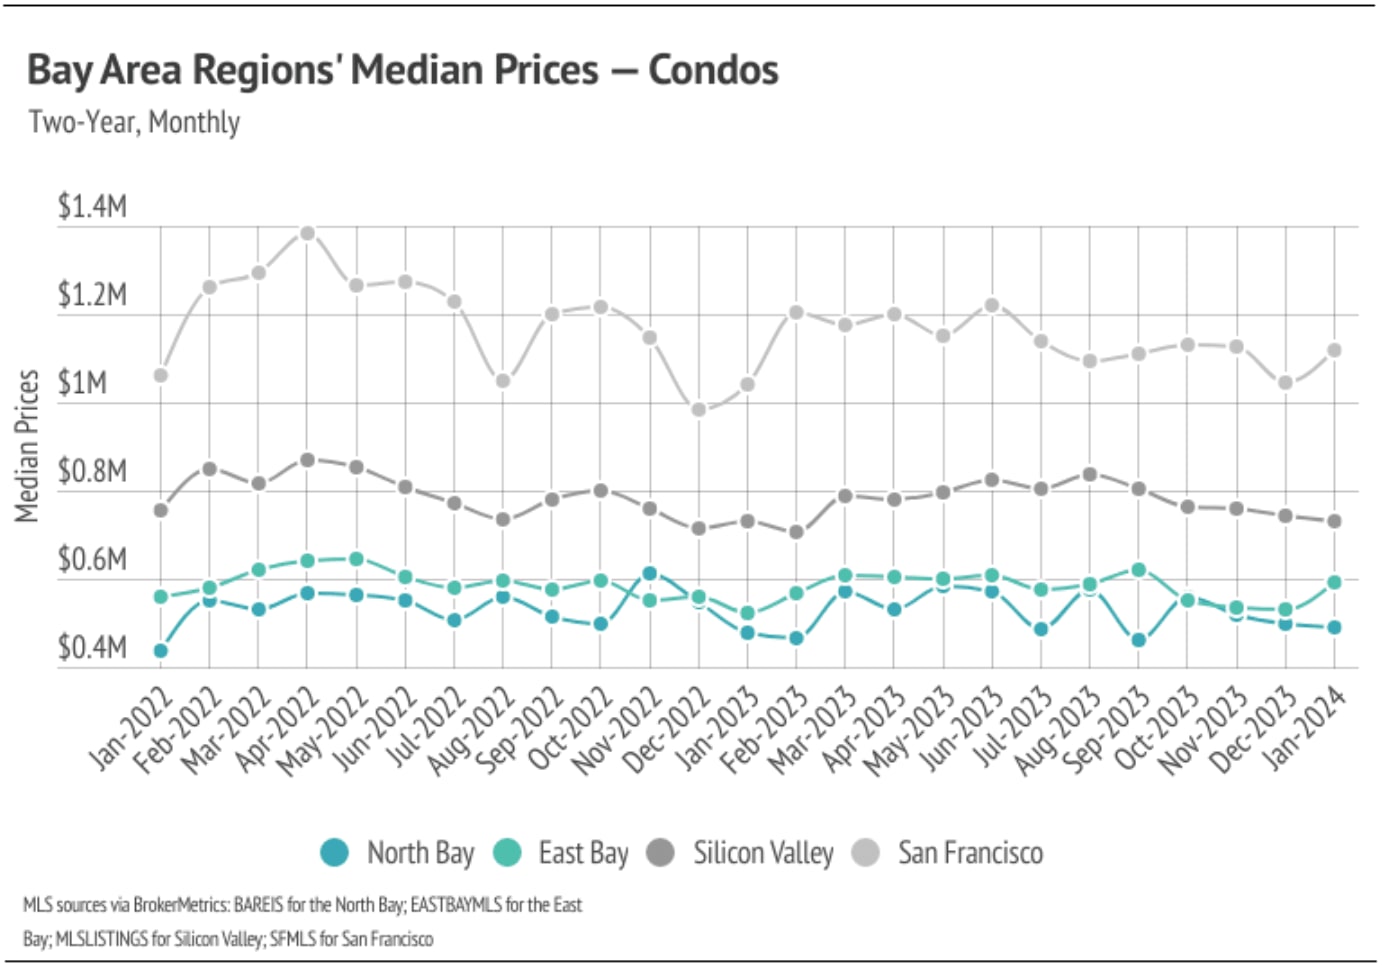
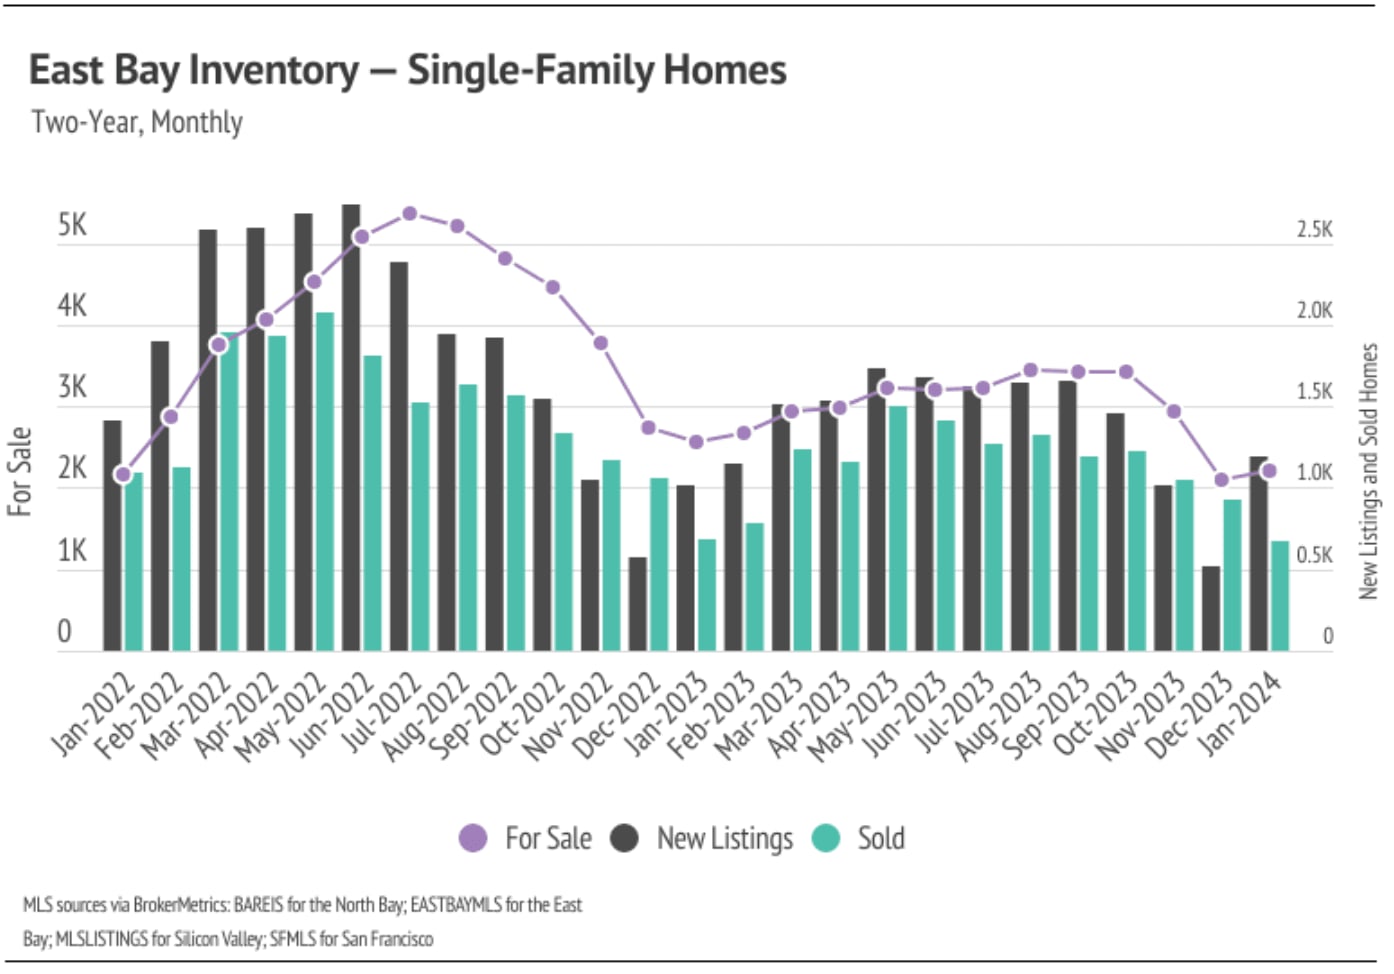
Quick Take: The median single-family home and condo prices rose meaningfully from December 2023 to February 2024, up 14.1% and 17.9%, respectively. Year-over-year pric… Read more

Michelle Kim | April 1, 2024
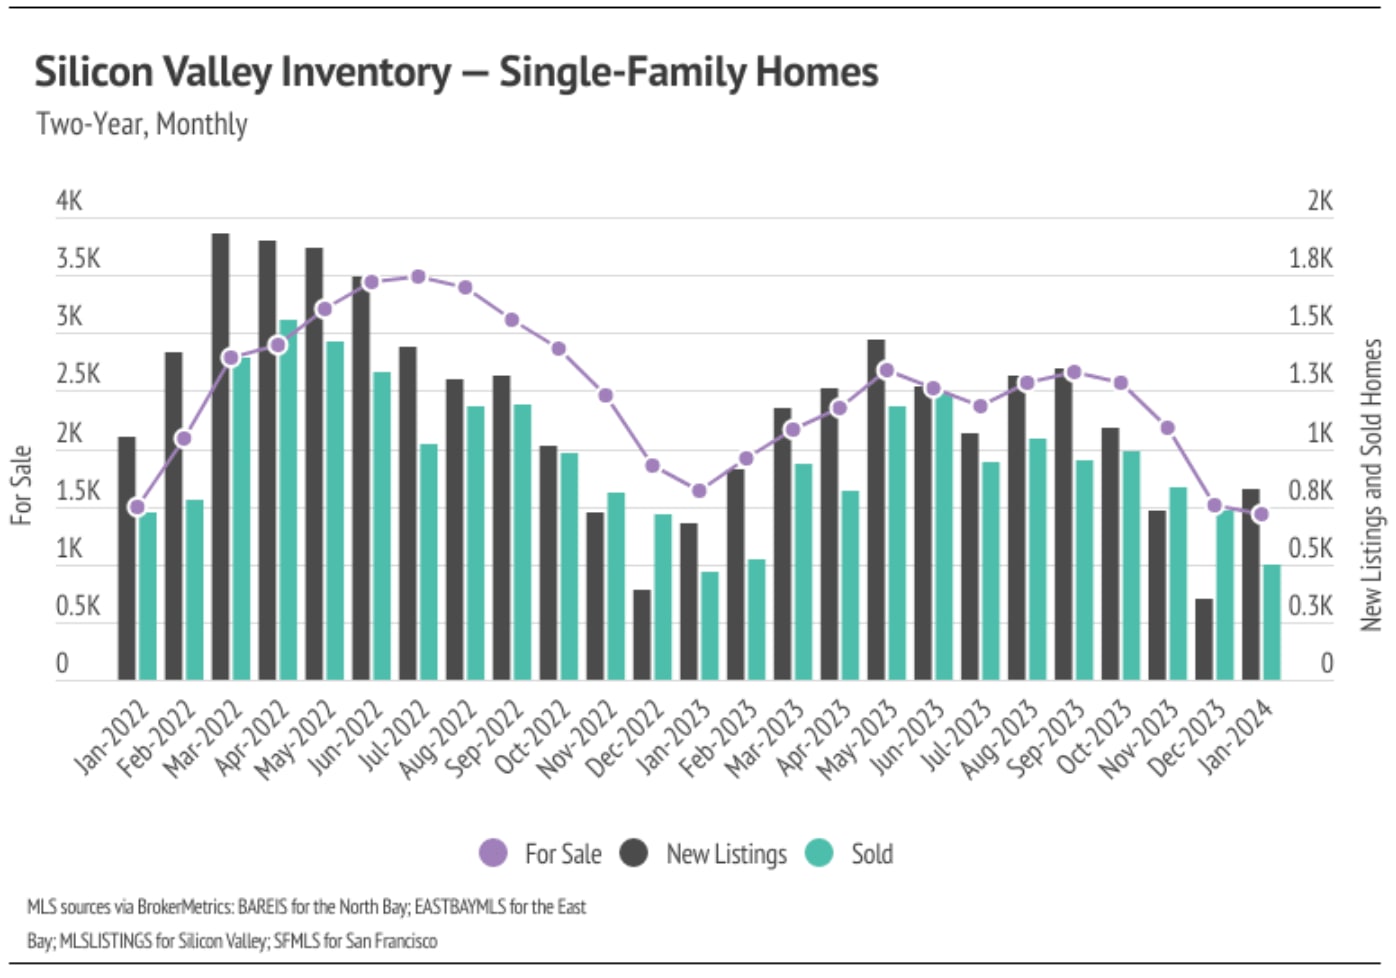
Quick Take: Single-family home prices appreciated year over year in Santa Clara and Santa Cruz, up 20% and 4%, respectively. We expect prices to remain fairly stable u… Read more
You’ve got questions and we can’t wait to answer them.