The Local Lowdown: January 2024

Stay up to date on the latest real estate trends.
Michelle Kim | May 3, 2024
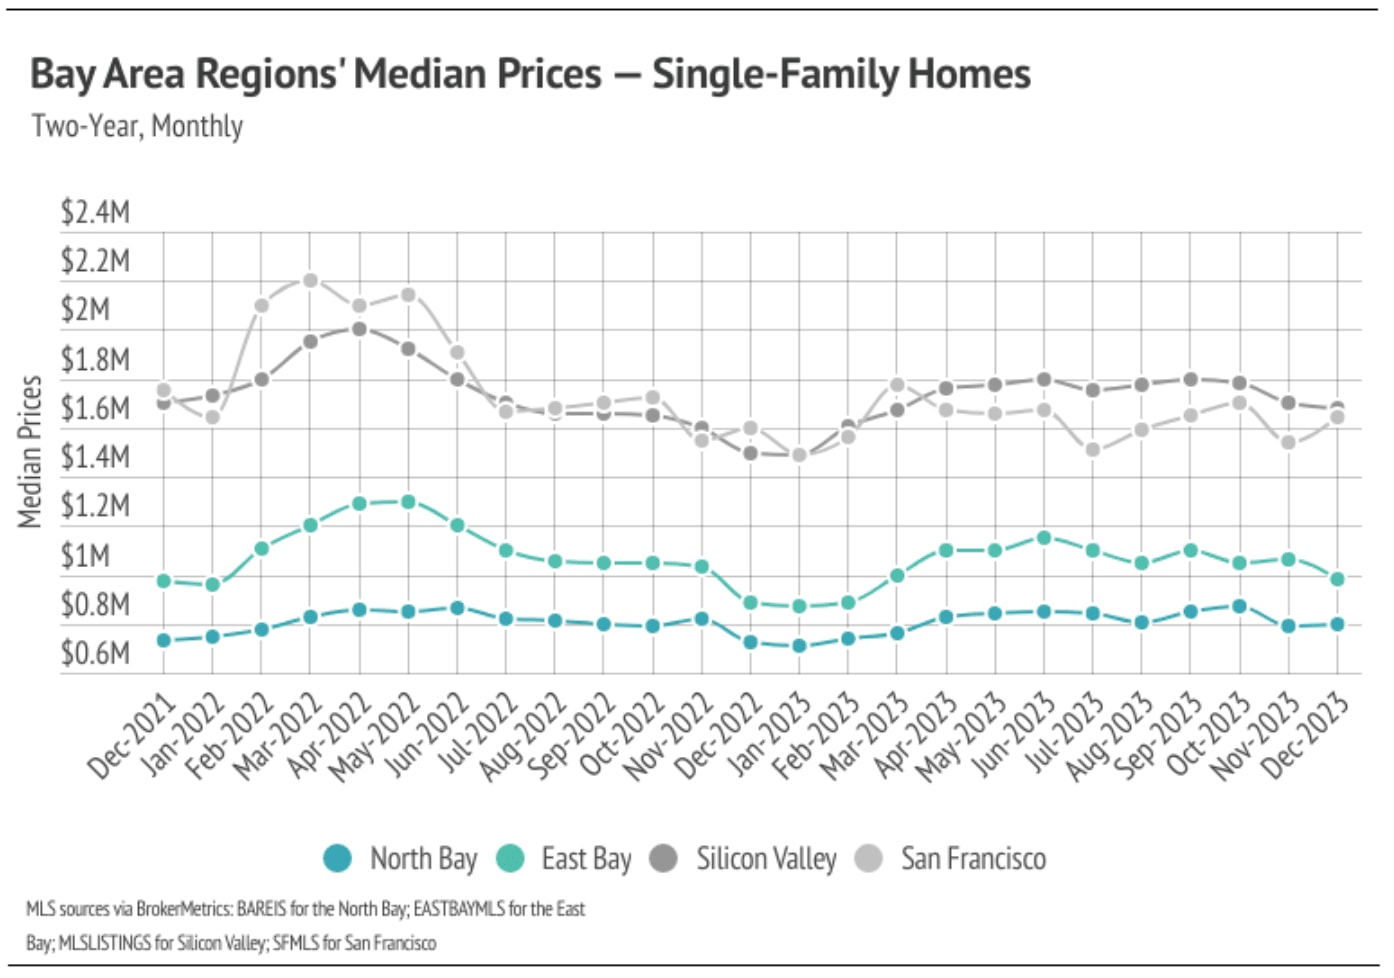
Quick Take: Median home prices are slightly below peak levels across the Bay Area. As more new listings come to market, we expect prices to continue rising and to reac… Read more

Michelle Kim | May 3, 2024
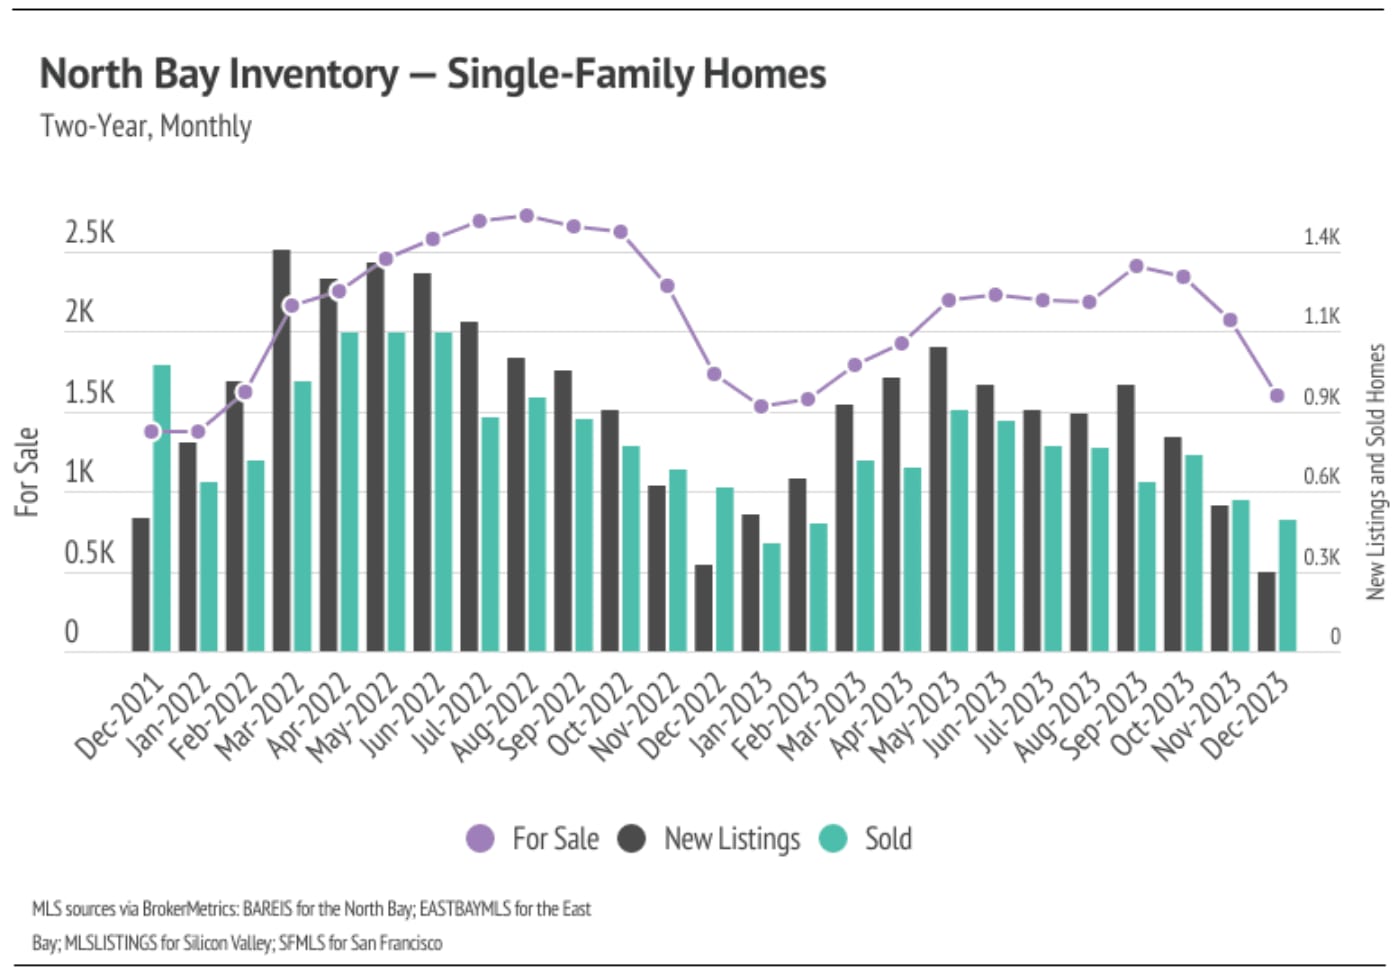
Quick Take: Median home prices are slightly below peak levels across the North Bay. As more new listings come to market, we expect prices across most of the North Bay … Read more

Michelle Kim | May 3, 2024
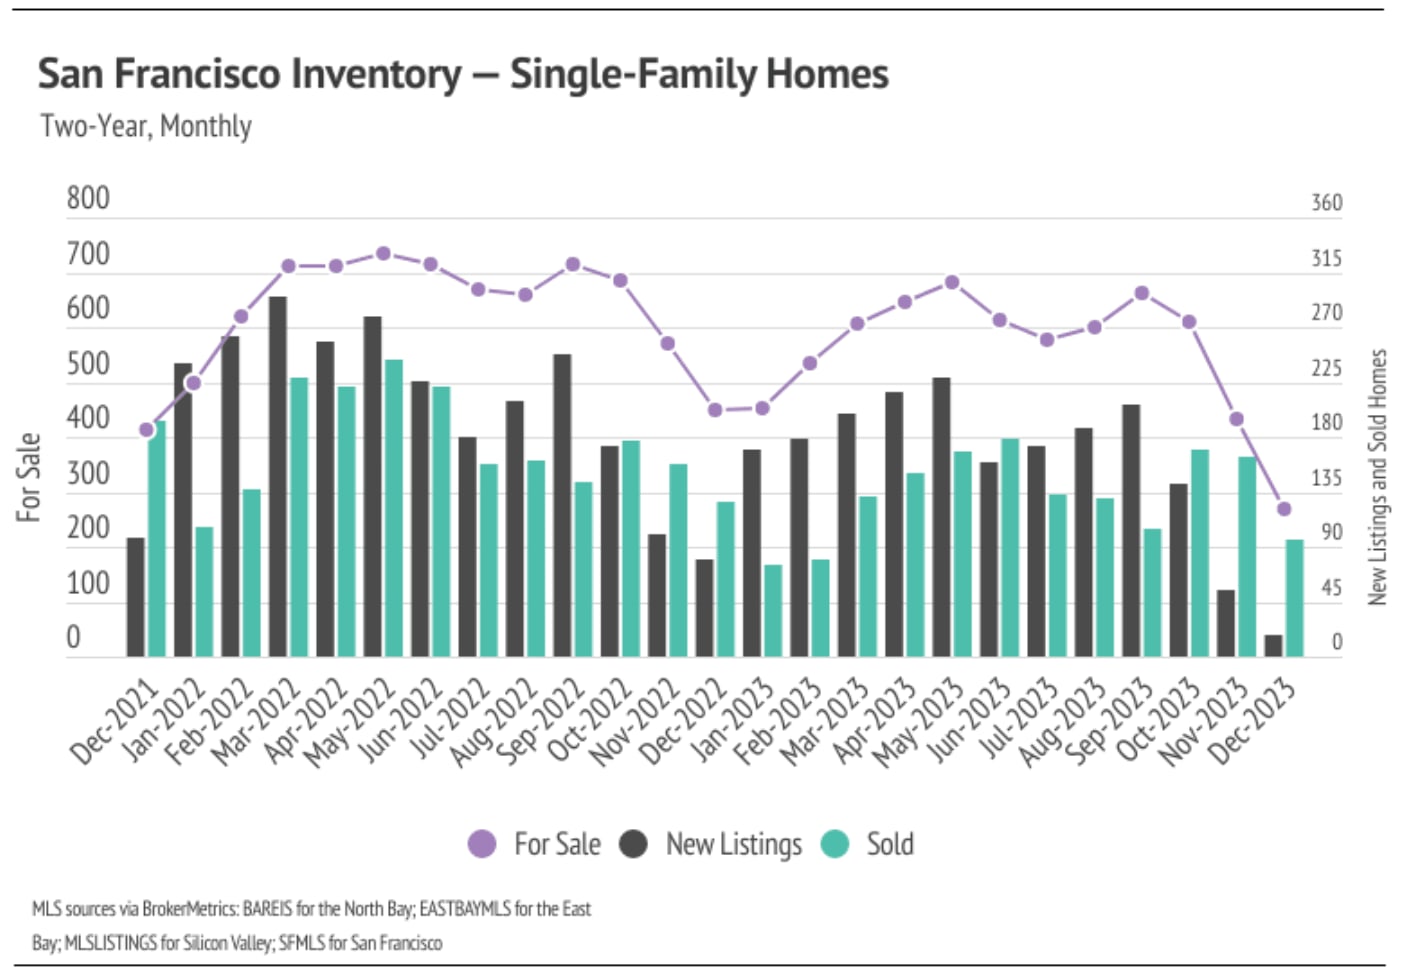
Quick Take: Median single-family home and condo prices rose meaningfully from December 2023 to March 2024, up 21.4% and 10.0%, respectively. Year-over-year prices also… Read more

Michelle Kim | May 3, 2024
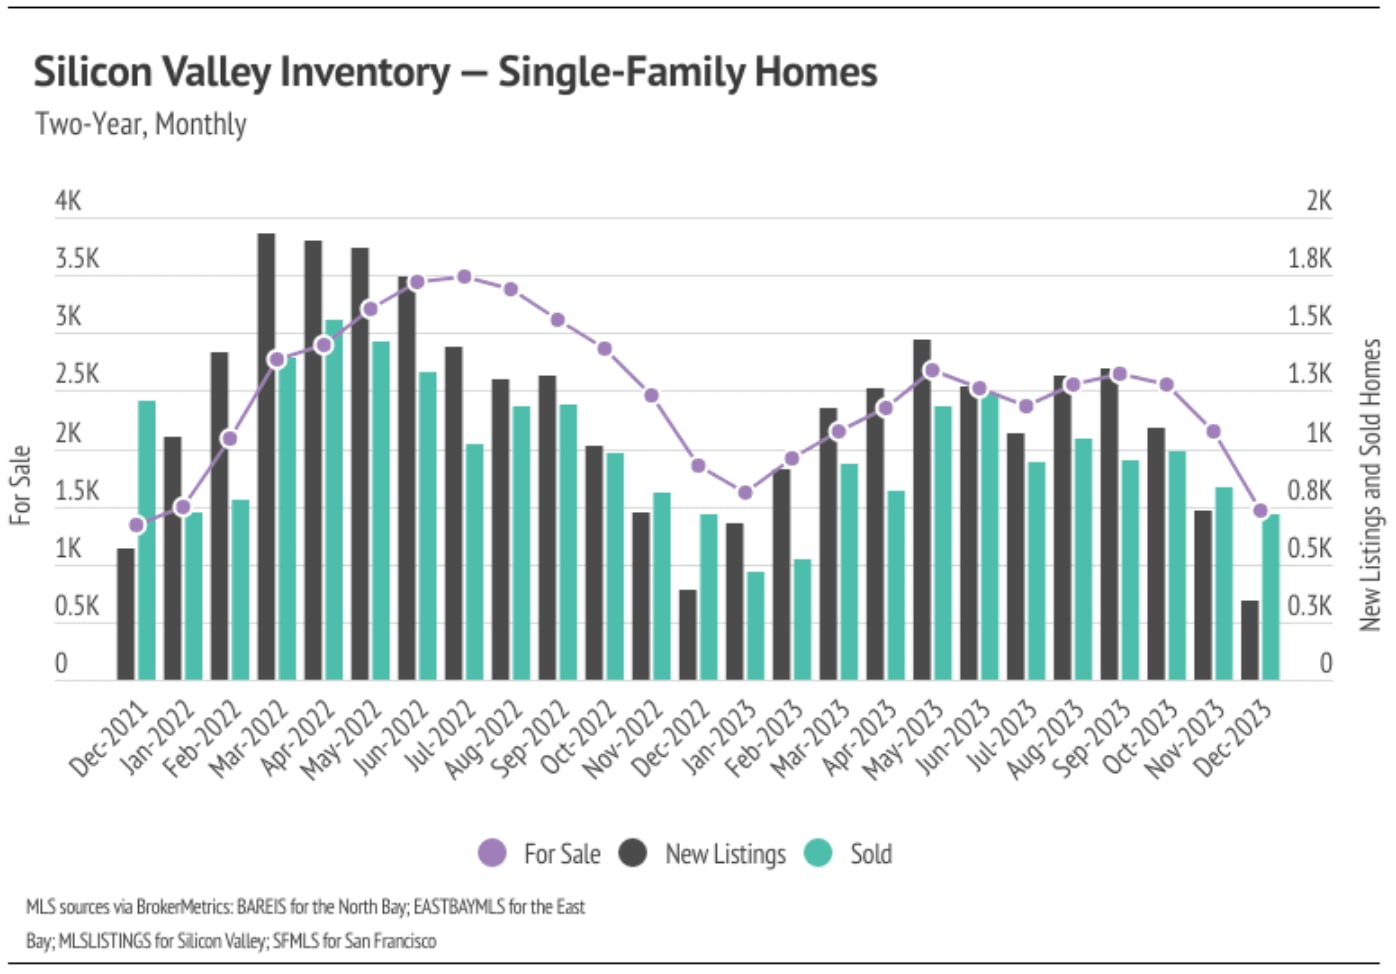
Quick Take: Median home prices are slightly below peak levels across Silicon Valley. As more new listings come to market, we expect prices to continue rising and to re… Read more
Michelle Kim | May 3, 2024
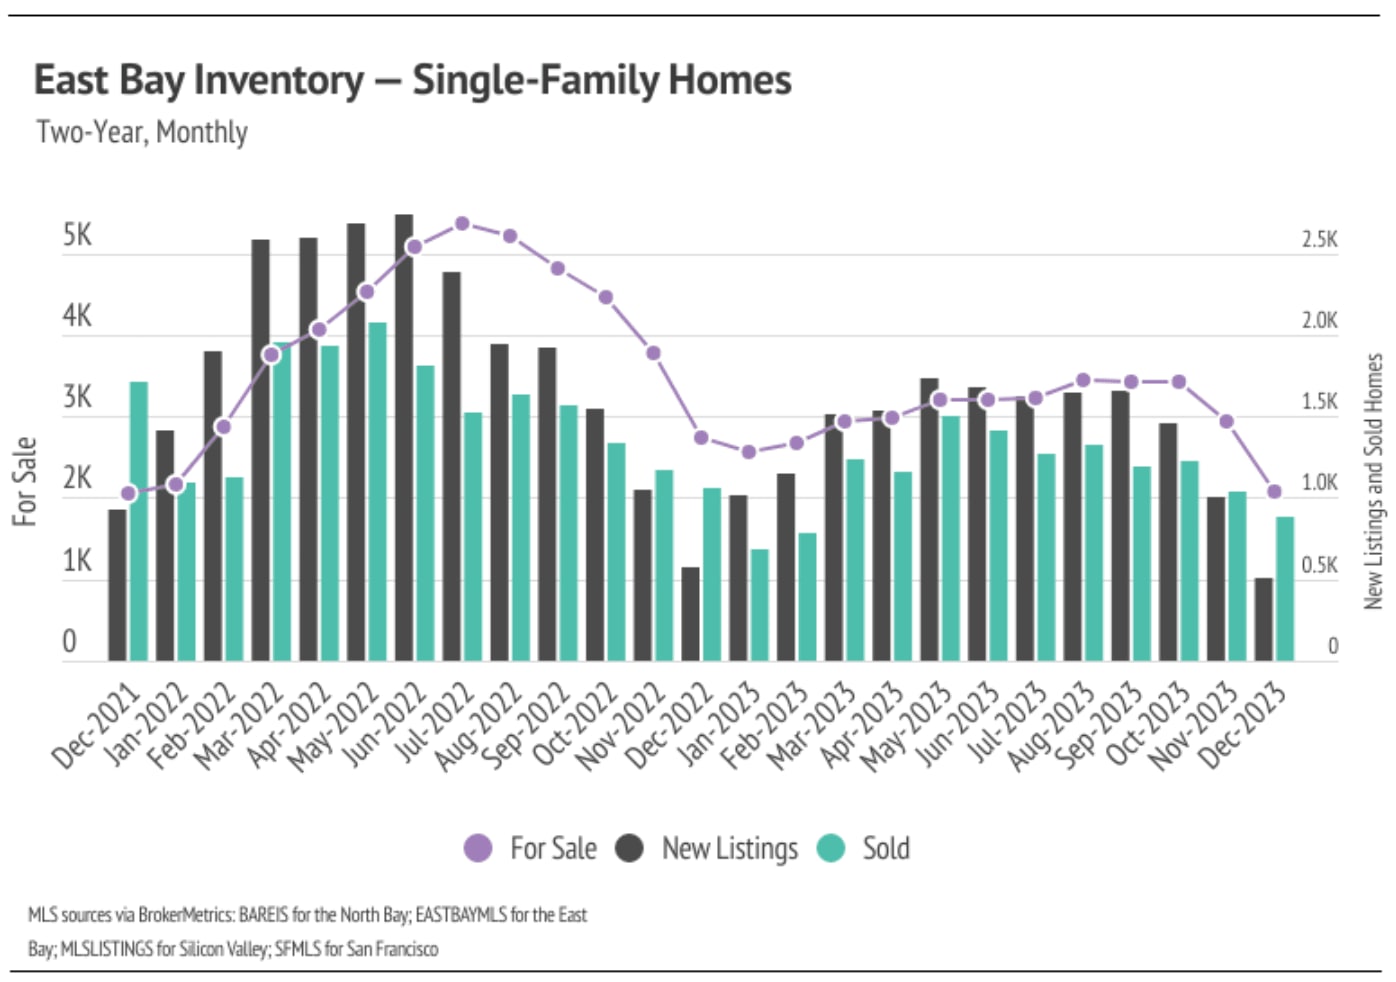
Quick Take: Median home prices are slightly below peak levels across the East Bay. As more new listings come to market, we expect prices to continue rising and to reac… Read more

Michelle Kim | May 3, 2024
Quick Take: The National Association of Realtors® (NAR) settled a major lawsuit in March. It’s still too early to tell exactly how real estate will be affected, since … Read more
You’ve got questions and we can’t wait to answer them.