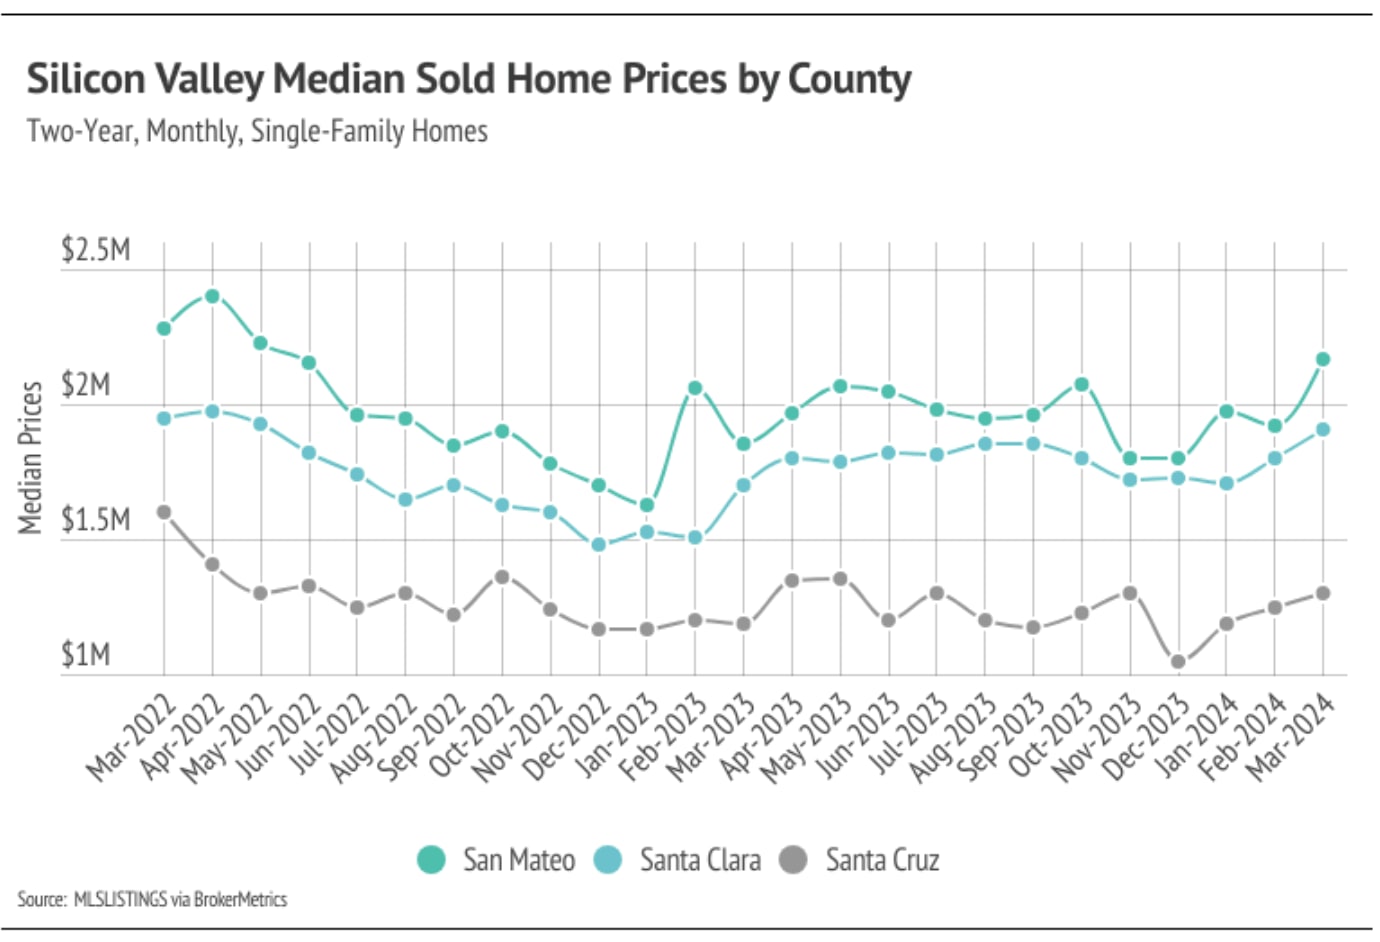
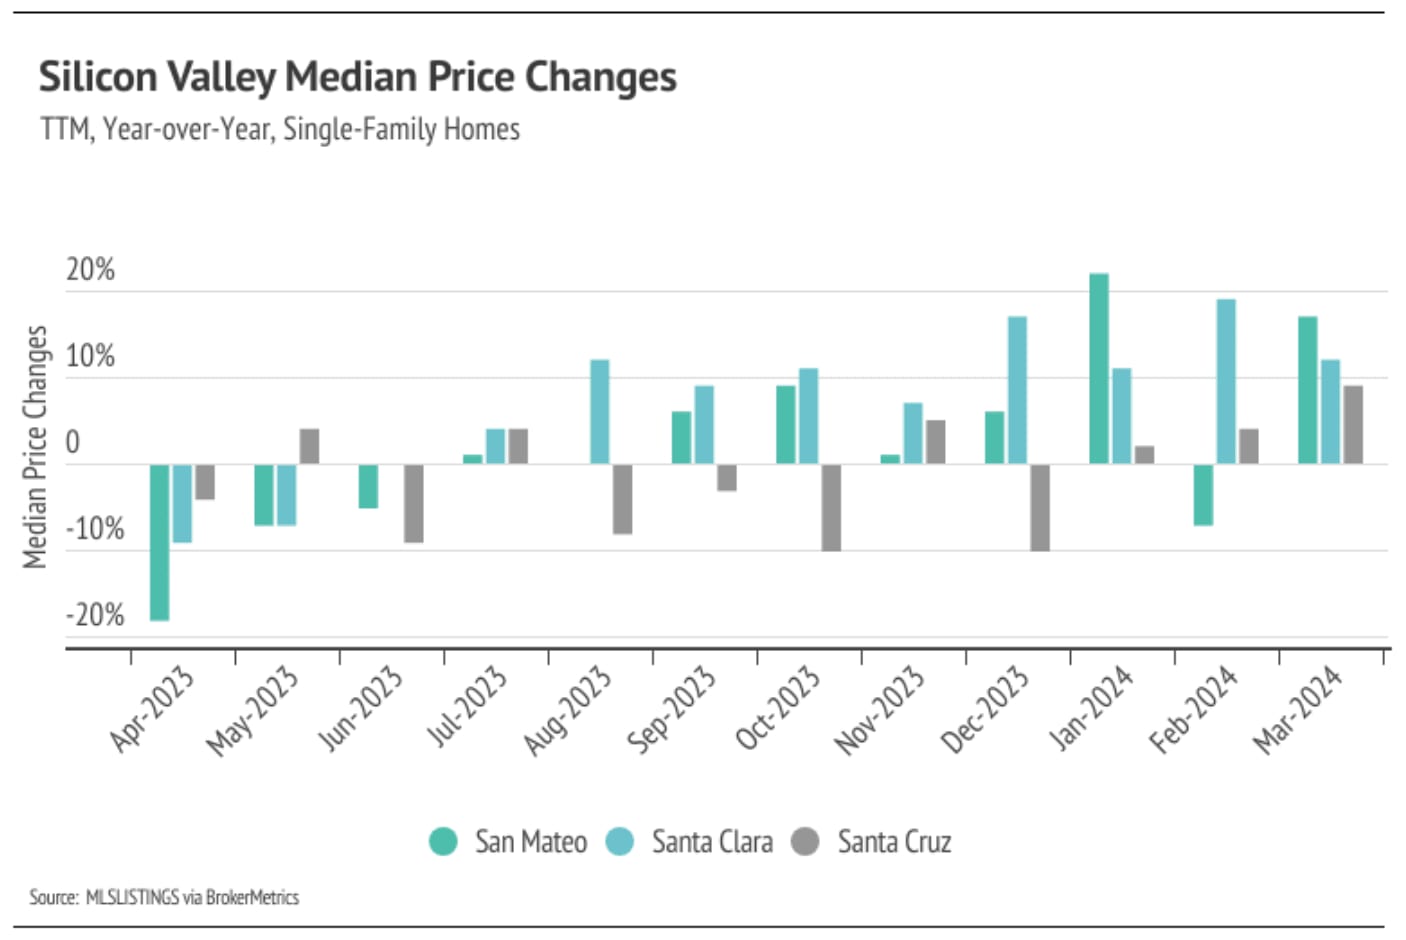
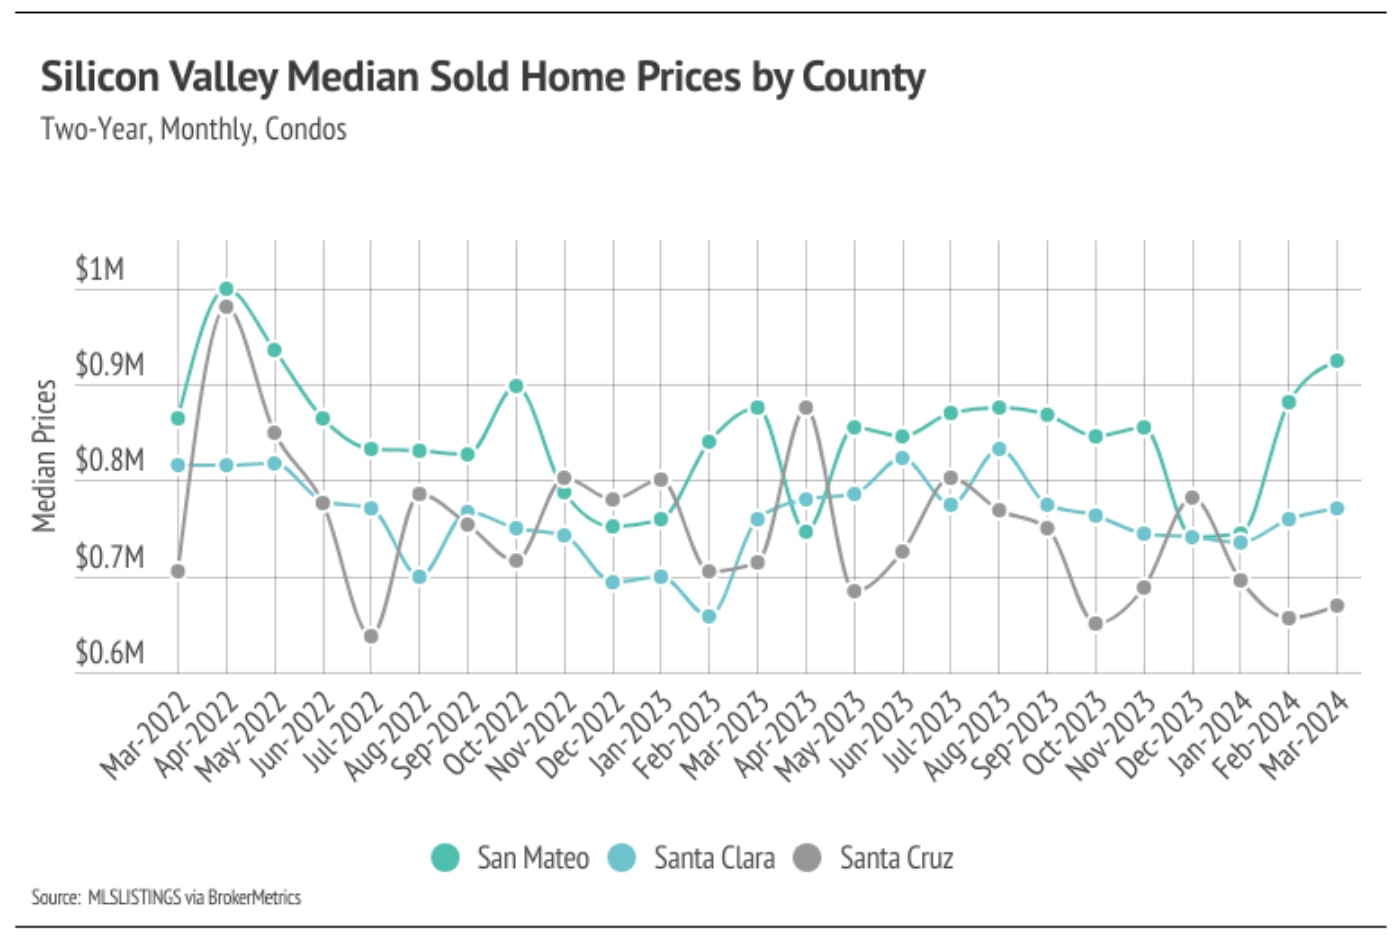
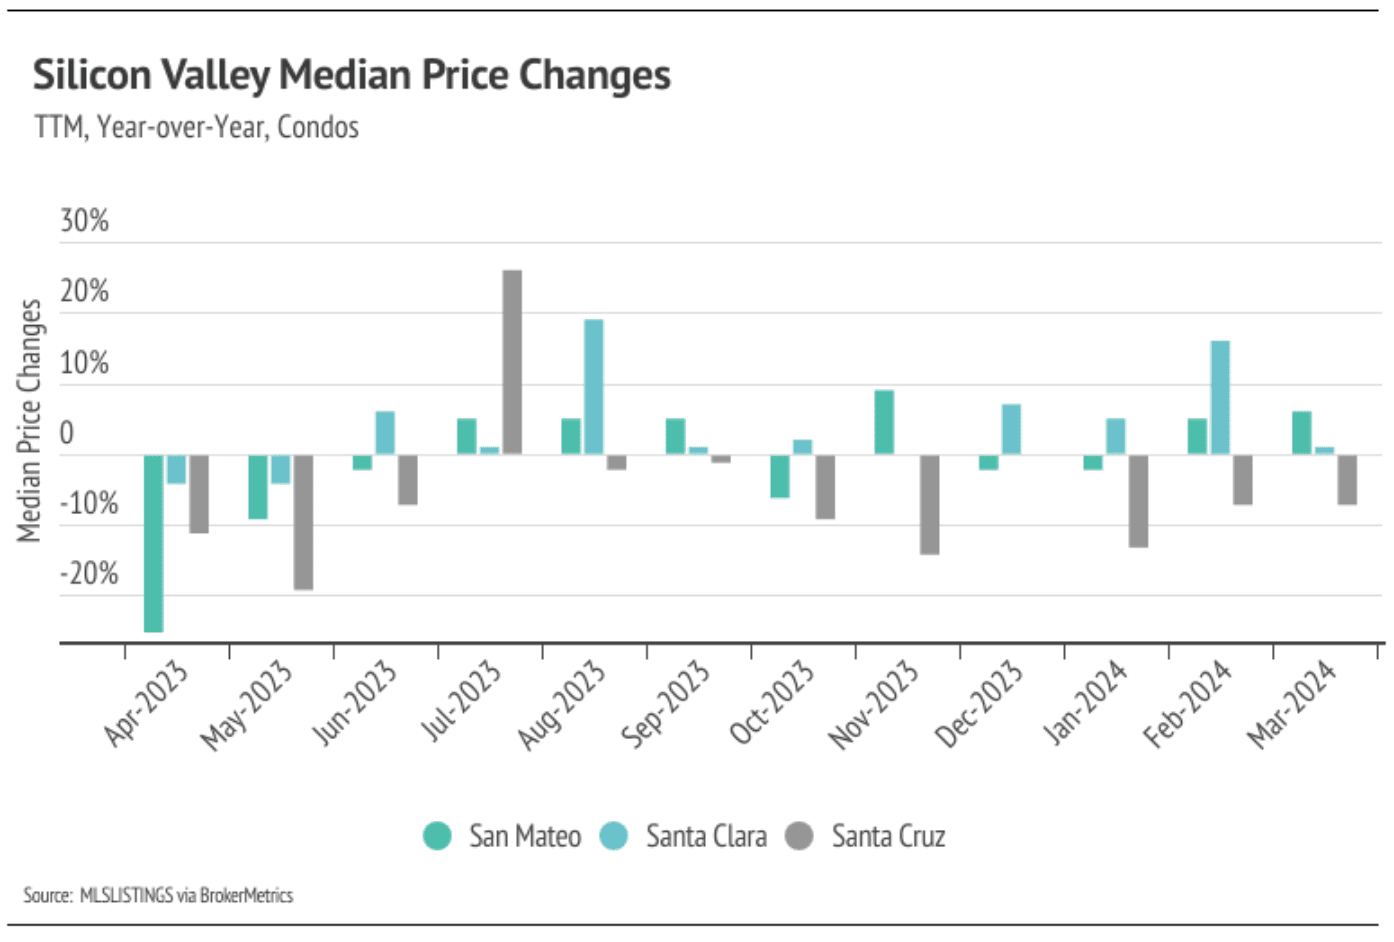
In Silicon Valley, low inventory and high demand have more than offset the downward price pressure from higher mortgage rates, and prices generally haven’t experienced larger drops due to higher mortgage rates. Month over month, in March, the median single-family home price rose 13% in San Mateo, 6% in Santa Clara, and 4% in Santa Cruz. Year over year, prices were also up across markets for single-family homes, up 17% in San Mateo, 12% in Santa Clara, and 9% in Santa Cruz. Condo prices rose across Silicon Valley from February to March as well, with the largest gain in San Mateo, up 5%. We expect prices in Silicon Valley to remain slightly below peak until the early summer, but prices will almost certainly reach new highs in the second quarter of 2024. Low, but rising inventory is only increasing prices as buyers are better able to find the best match.
High mortgage rates soften both supply and demand, but at this point rates have been above 6% for 16 months, and rate cuts will likely occur sometime this year. Potential buyers have had longer to save for a down payment and will have the opportunity to refinance in the next 12-24 months, which makes current rates less of a limiting factor. However, high demand can only do so much for the market if there isn’t supply to meet it.
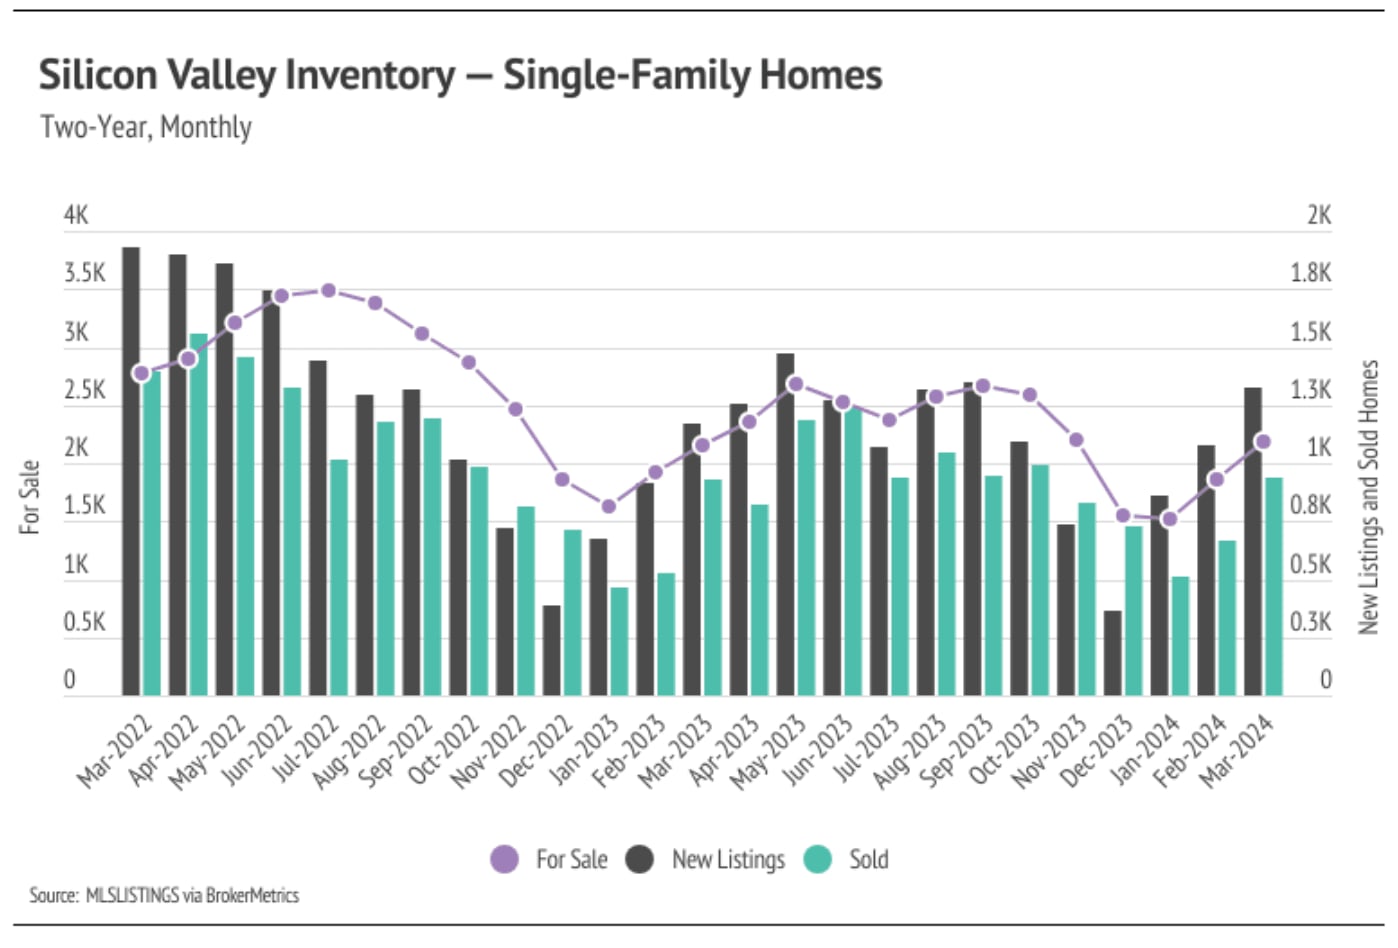
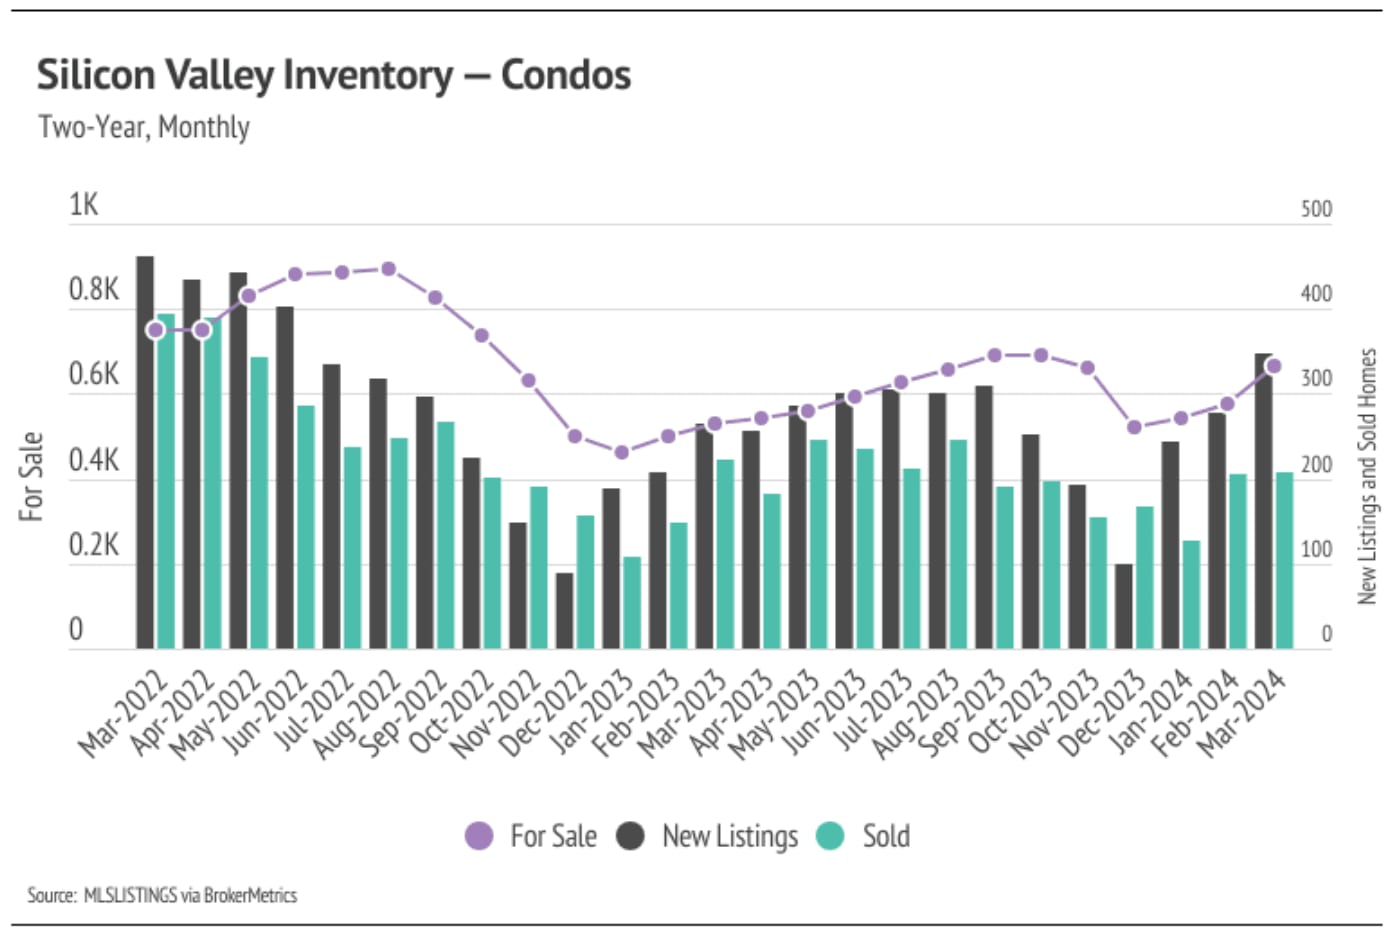
Single-family home and condo inventory, sales, and new listings increased month over month
Since the start of 2023, single-family home inventory has followed fairly typical seasonal trends, but at significantly depressed levels. Low inventory and fewer new listings have slowed the market considerably. Typically, inventory peaks in July or August and declines through December or January, but the lack of new listings prevented meaningful inventory growth. Last year, new listings and sales peaked in May, while inventory peaked in September. New listings have been exceptionally low, so the little inventory growth in 2023 was driven by softening demand. In December 2024, inventory and sales dropped, but more new listings came to the market in 2024, which has driven the significant increase in sales in Q1 2024. The market is already looking healthier, and we expect more new listings and sales in Q2 2024.
With the current low inventory levels, the number of new listings coming to market is a significant predictor of sales. New listings rose 24% month over month, and sales followed suit, increasing 31%. Year over year, inventory is up 6%; however, sales are still down 1%. The next three months will be critical to our understanding of the market. More supply will mean a healthier market and a more normal housing market in 2024.
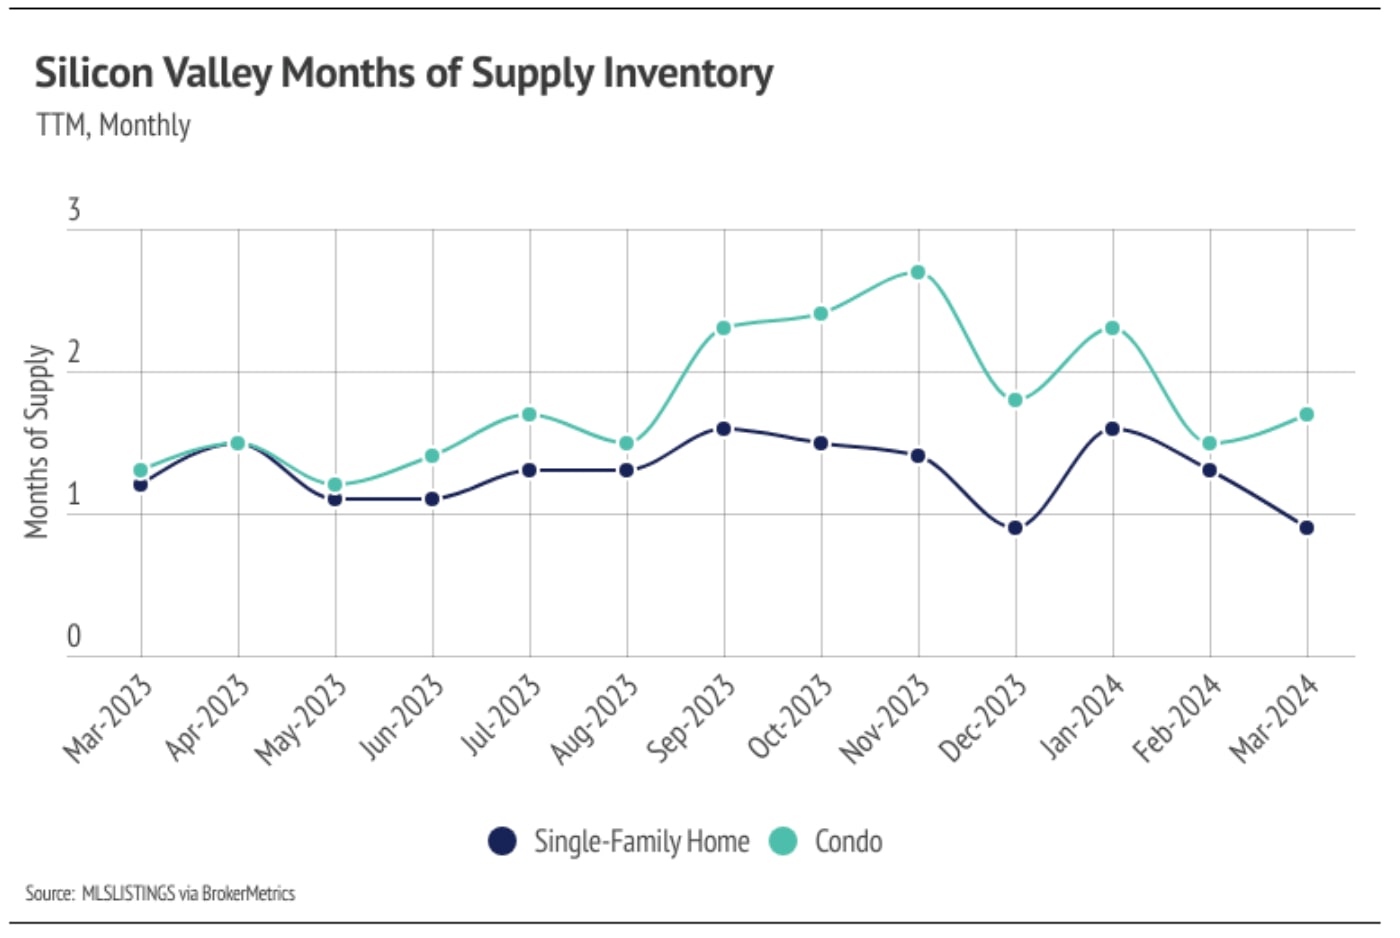
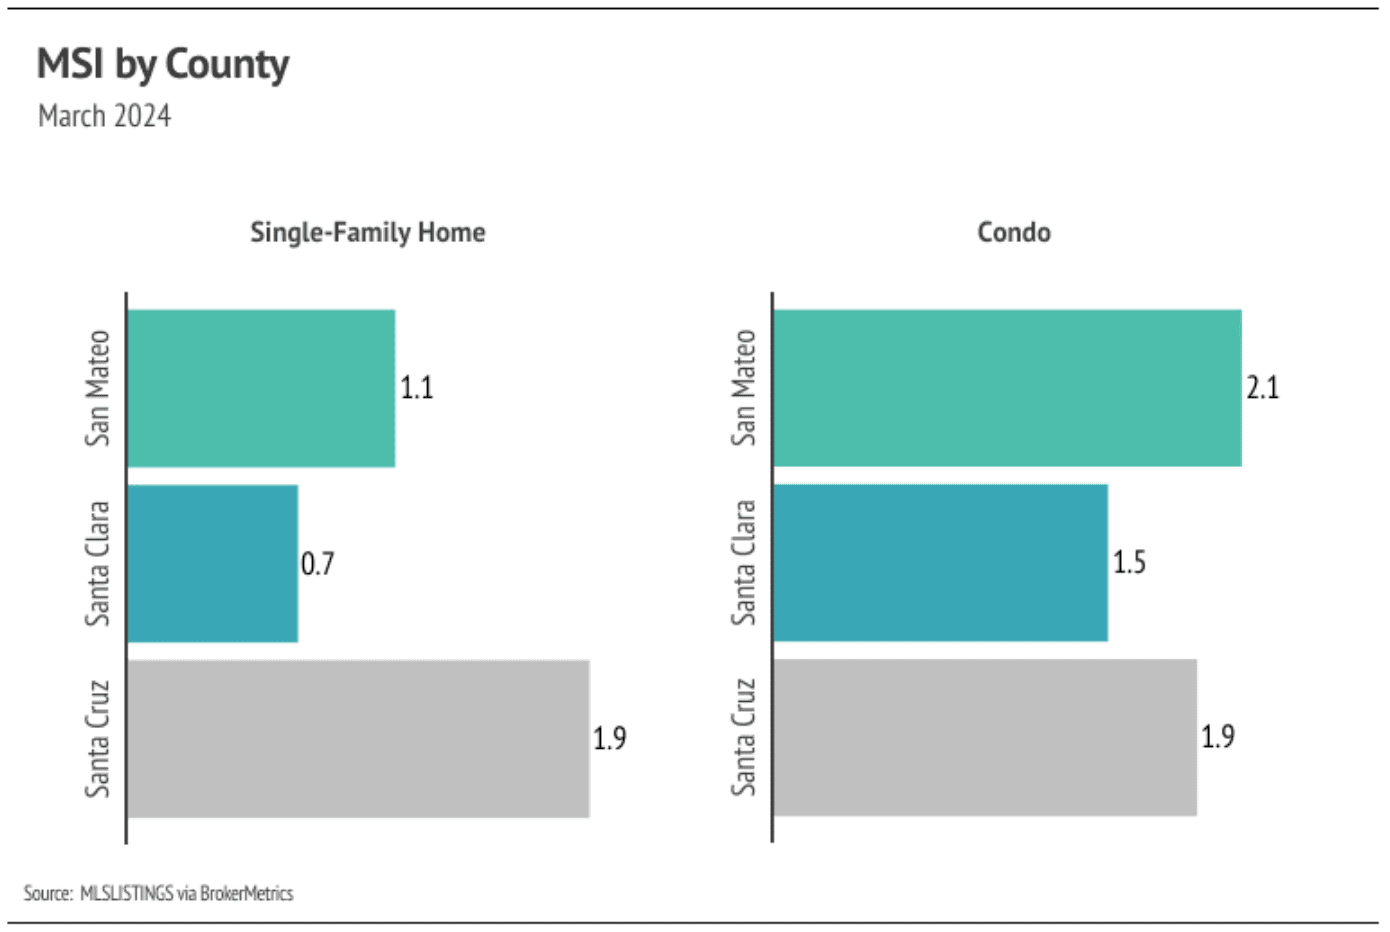
Months of Supply Inventory in March 2024 indicated a sellers’ market
Months of Supply Inventory (MSI) quantifies the supply/demand relationship by measuring how many months it would take for all current homes listed on the market to sell at the current rate of sales. The long-term average MSI is around three months in California, which indicates a balanced market. An MSI lower than three indicates that there are more buyers than sellers on the market (meaning it’s a sellers’ market), while a higher MSI indicates there are more sellers than buyers (meaning it’s a buyers’ market). The Silicon Valley market tends to favor sellers, which is reflected in its low MSI. MSI trended higher in the second half of 2023, but never climbed above three months of supply. In February and March 2024, single-family home MSI fell significantly, indicating the housing market strongly favors sellers. For condos, MSI rose in March but is still quite low, also implying a sellers’ market.